This post continues the tale of my Freifunk experience I had while spending a week on a castle in Germany. In this part I’ll have a closer look at the performance of my network node and how it was used during the time I ran it at the castle.
Freifunk Operation
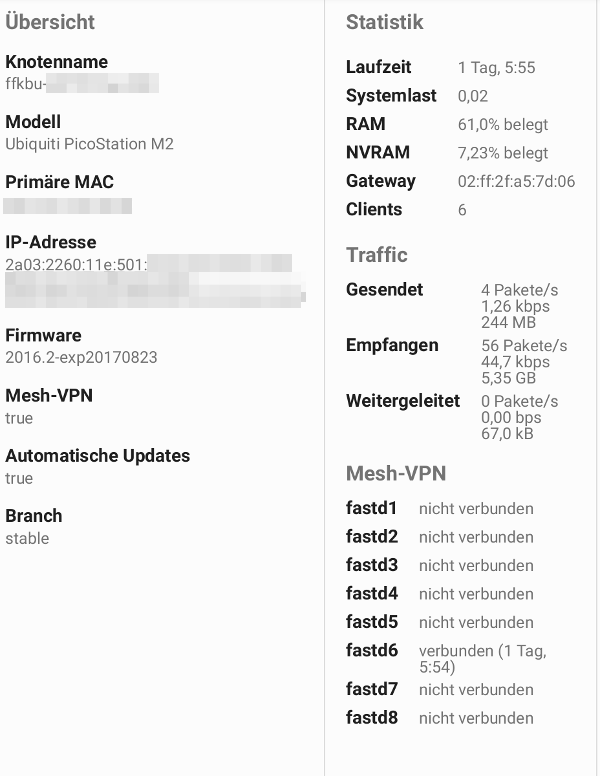
After setting up my Freifunk node, I decided not to actively advertise it but to wait a bit and see if people would find it on their own. It took only a few hours before the first Internet connectivity starved people noticed the open network and connected their devices. After a day, there were around 10 users, some of them using the network quite heavily. Total network traffic was around 3-4 GB a day, most of it in the downlink direction. In other words, you better have a big monthly data allowance for your LTE backhaul connection. After running the Wifi access point router for a couple of days without rebooting it I can attest to the stability of the software.
Throughput Observations
One disadvantage of using an encrypted backhaul to protect the operator of the access point is that it takes a heavy tool on performance. While my LTE backhaul capacity was around 70 Mbit/s in the downlink and 30 Mbit/s in the uplink direction, the Freifunk software on my Ubiquiti Picostation 2HP Wifi AP could only sustain a data rate of 10 Mbit/s through the tunnel. Other Wifi APs with stronger processors are said to support up to 20 Mbit/s. While 10 or 20 Mbit/s was quite a good number a few years ago, capacity demands are rising fast. If it isn’t already, tunnel performance will become a serious bottleneck in the foreseeable future if things are left as they are today. There are ways to increase overall throughput at a location, however, for example by running several access points at different locations at a site, run them on different frequencies and split them over the 2.4 and 5 GHz bands.
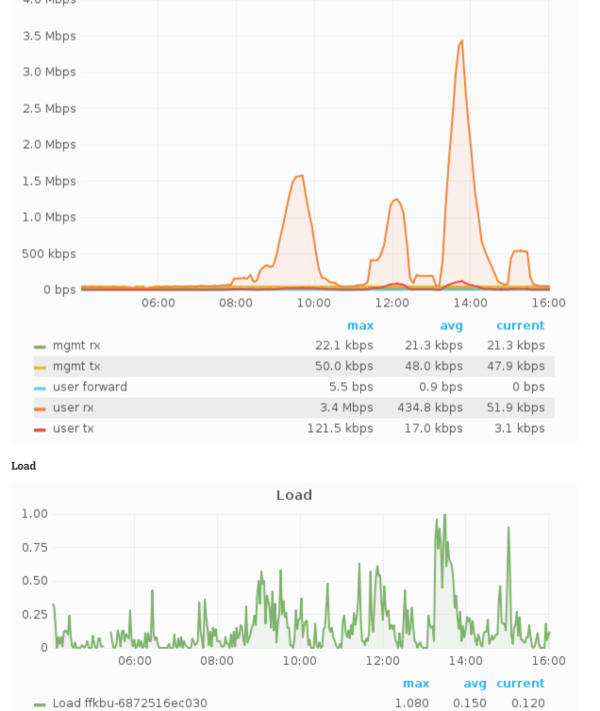
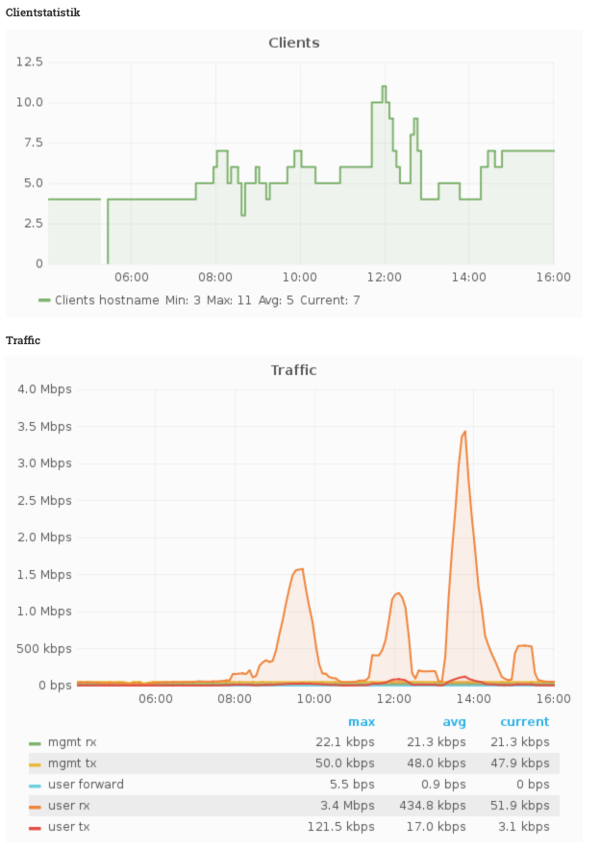
The screenshots on the left show the usage graph of my network. The traffic diagram seems to aggregate throughput over 5 to 10 minutes for each data point so it doesn’t show the peak data throughput that is possible or was used. The green load graph seems to be the peak CPU load over a certain period and give a more accurate picture of the throughput load on the network. A CPU load of 1 means a peak of 10 Mbit/s during an interval, 0.5 equals a peak of 5 Mbit/s was reached during a given interval.
Under The Hood – What’s On The Wire?
One rally cool thing is that Freifunk supports both NATed IPv4 and public IPv6 addresses for clients! This comes a bit of a price, however. Despite Freifunk being a decentralized network, the layer 2 broadcast traffic sent to all devices in the network is huge. In my broadcast area I could detect over 500 individual devices that were all sending their IPv6 Neighbor solicitation broadcast messages once every minute. This generates a management load of around 50 kbit/s which is around 18 MB a minute or over 450 MB per day. This number does not include any user data and is quite a lot if you have a metered backhaul connection. Another disadvantage of such a large broadcast domain is that there are around 40 IPv6 multicast advertisement packets per second in the air. That makes it very difficult for the Wifi chip to power down to conserve power. Interestingly enough it didn’t seem to have a devastating effect on my smartphone. Battery consumption while not used was less than 1% per hour despite of it.
Summary
All in all, operation of my mini-network was smooth throughout the week and I’m happy I could help out a couple of people to get connected. I’m sure this won’t be the last time I’ve used my setup. To be continued.