In the previous post, I’ve had a look at how a high speed data transmission is throttled to 500 Mbps between two data centers in different countries. In this post, I’ll have a look how the TCP sequence- and transmission window graphs look like for the same throttling scenario when I downloaded data from my server over an FTTH fiber line in Paris.
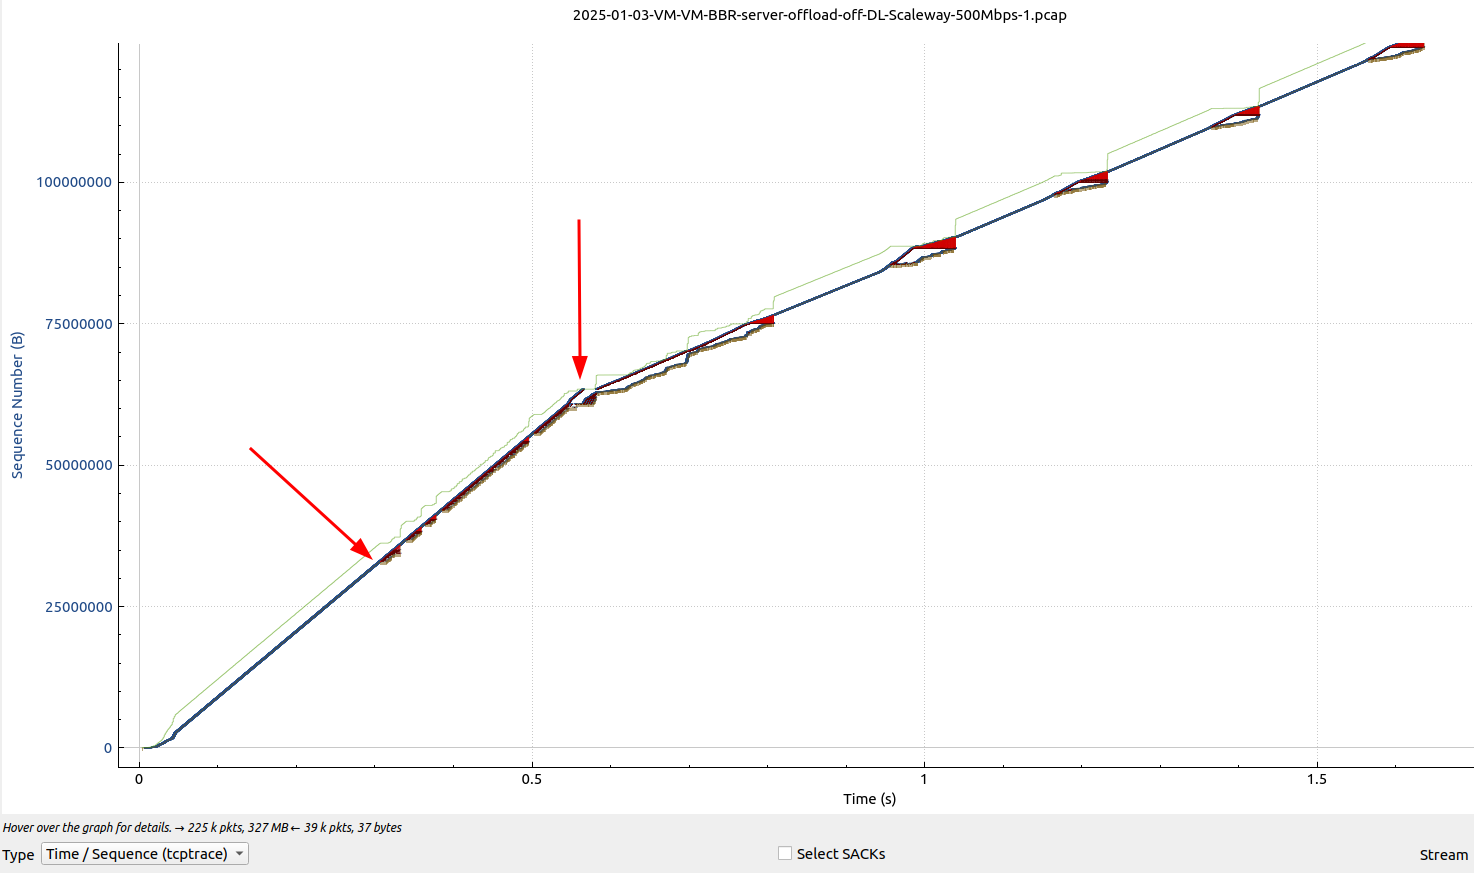
The graph above shows the Wireshark TCP sequence graph of an iperf3 TCP downlink throughput test I ran from a VM in a data center in France to my computer over an FTTH fiber line in Paris. Like in the previous post, TCP BBR was used instead of the standard CUBIC flow control algorithm. Up until around 300ms of the data transfer (first red arrow on the left of the screenshot above), no bandwidth shaping or throttling is applied. One can see the TCP slow start mechanism doing its work at the beginning until 300ms in the graph. Once slow start is done, the data transfer rate is then around 800 Mbps, the same as in the data center to data center connection analyzed in the previous post.
But there are a number of extra effects that can be observed: At 300ms into the data transfer, I started to get some packet loss which I did not see over the ‘pure’ data center to data center connection I used in the previous post. Up until 700 ms into the transmission however, the packet loss had no impact and the data rate of 800 Mbps was kept up. This is because BBR does not care about packet loss and only throttles down when latency grows.
At 600ms into the data transfer (second red arrow), the throttling sets in as described in the previous post, i.e. this packet loss has nothing to do with my FTTH line, but is the data center’s throttling taking effect.
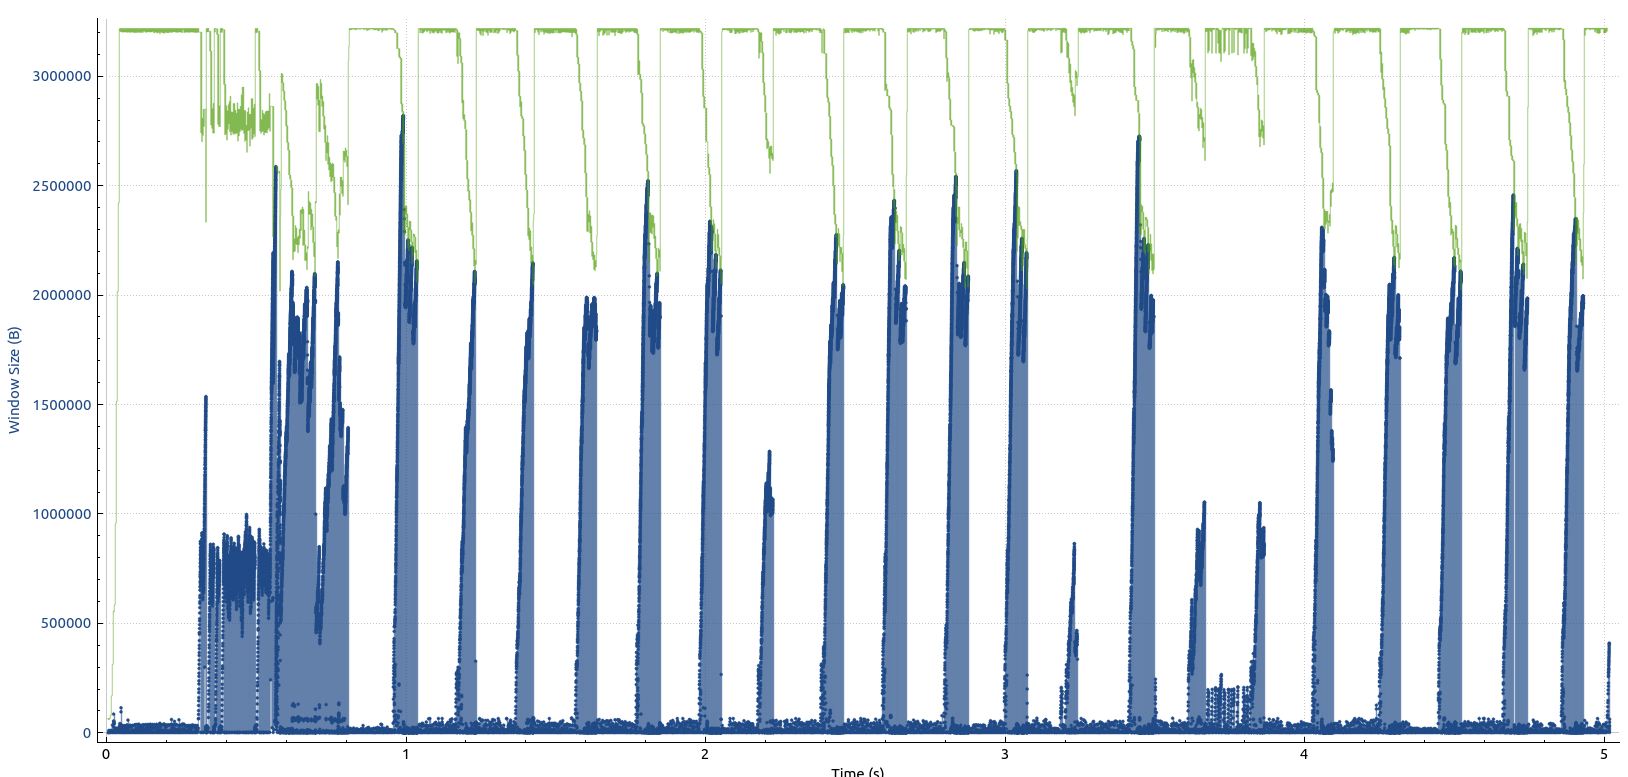
Overall the throughput then remains at 500 Mbps. From a receive window point of view, there’s also an interesting graph, shown below. It looks very similar to the window graph in the previous post, i.e. discarding packets has the effect that the packet loss leads to a decrease in TCP receive window size and subsequently to throttling when the bytes in flight reach the maximum window size, i.e. when the blue line in the graph (unacknowledged bytes) meet the green line (window size).
So lots is happening in the background while on the surface, the only thing that is seen during the download is an average throughput of 500 Mbps.