In the previous post on this topic, I had a closer look at the write performance of the best backup hard drive I had in stock at home. I bought that drive recently, because I was running out of space on my other drives and because they somehow did not seem to behave as snappy as when I initially bought them. So let’s have a look and compare.
For completeness sake, here’s the graph of my 20 TB Seagate drive again I bought in late 2024, as I’ll use it as a baseline:
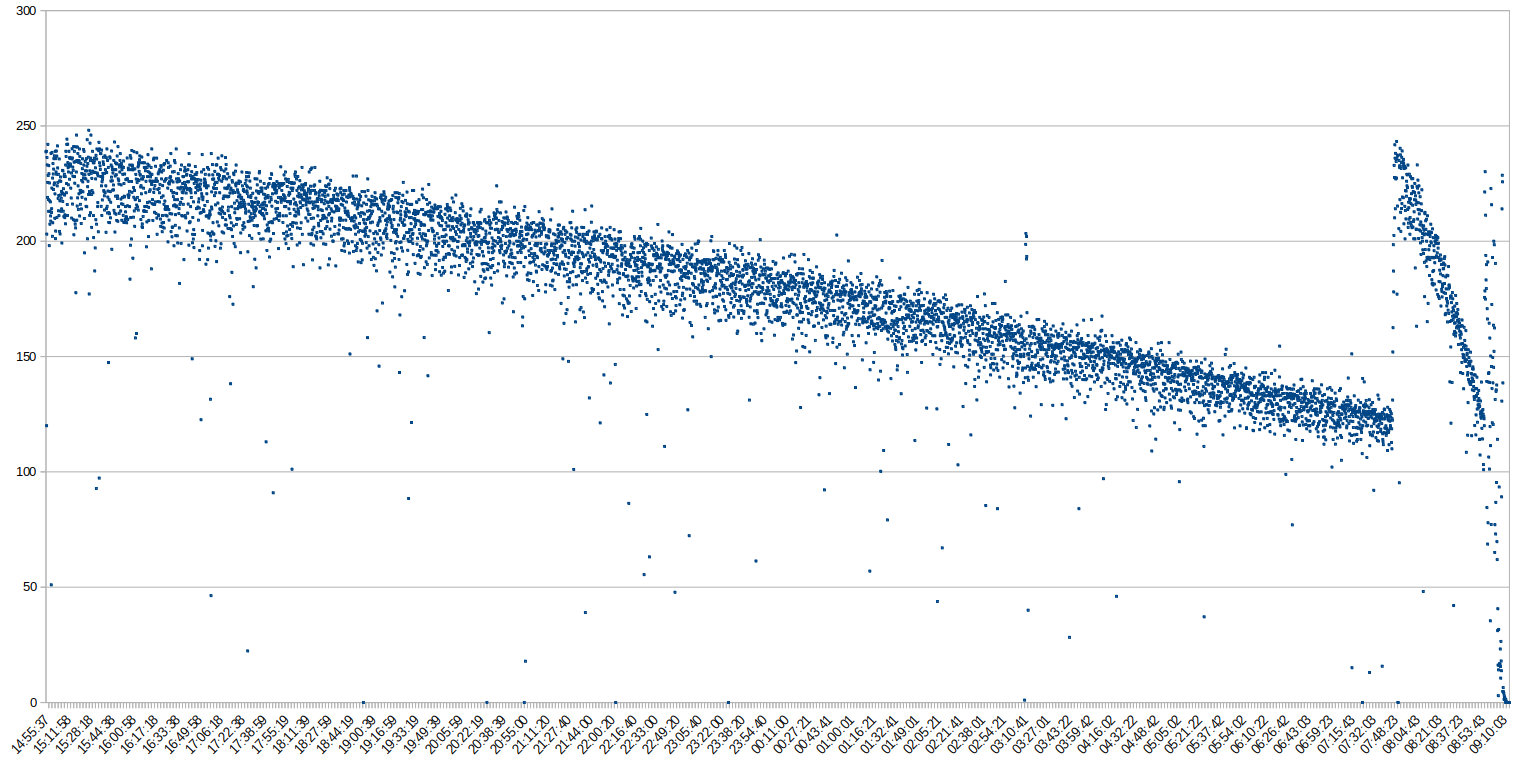
The x-axis in this graph shows time and the y-axis shows the data write speed to this drive when completely filling it up with large 50 GB files. Long story short, the drive gets slower over time and the average write speed for 20 TB of data with large files is 177 MB/s. For further details see the previous post.
Now let’s have a look at one of my older 8 TB drives with a production date of October 2019:
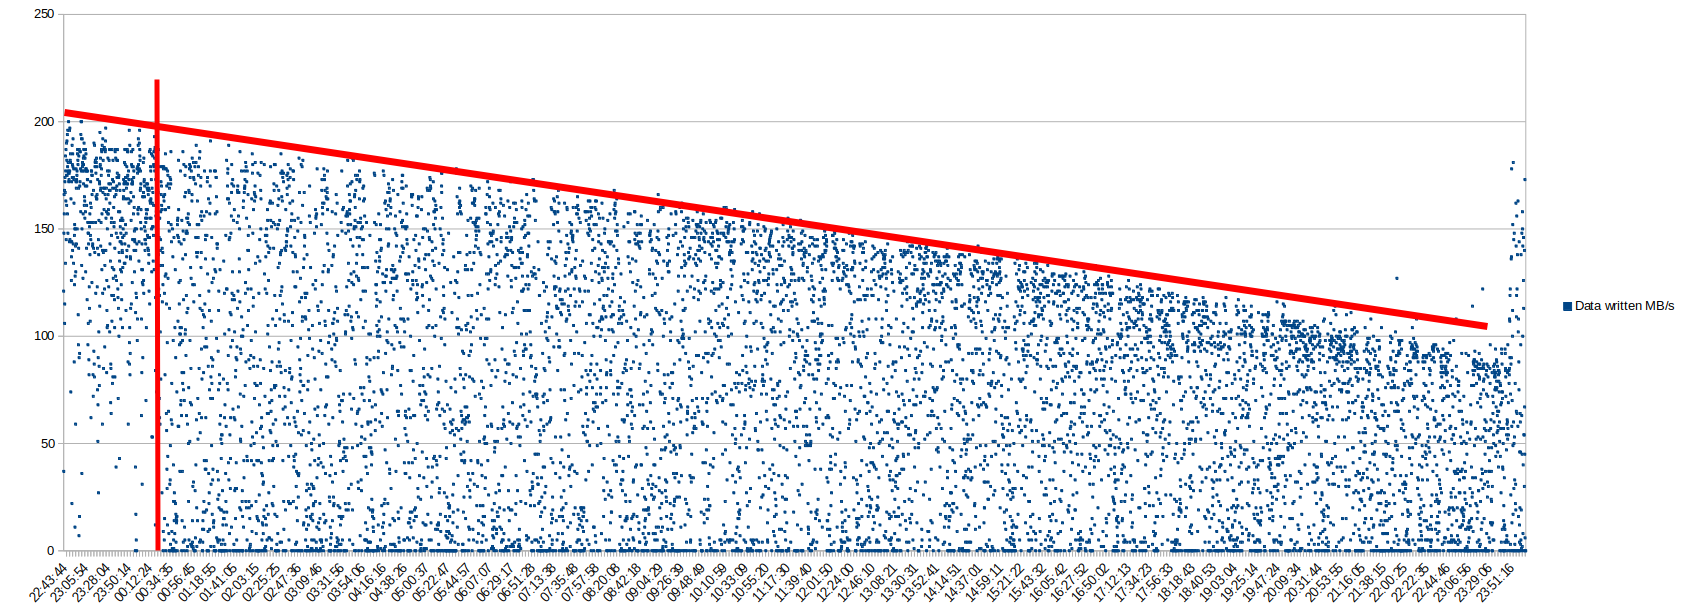
This graph looks completely different to the graph above. For about 2 hours at the beginning of the 50 GB files write process, the drive behaves similarly to the first drive, but one can already see many write speed dots that are well below the maximum speed. At about 2 hours into the write process, which I have marked with a vertical red line in the graph, the behavior significantly changes. Suddenly, there are many more data points that show a much lower write speed and there are lots of datapoints which are completely 0, i.e. nothing written to the drive for 1 second. I am not sure what the reason for this change is, but it is very likely that this is caused by ‘Shingled Magnetic Recording’ (SMR), which requires data already written to be re-written again when new data is added on the platters next to it. As I said, I can’t be sure that this is the reason, but my result looks very similar to the second write throughput graph in this AnandTech article. I then opened the external casing of the USB attached disk drive to have a look at the actual disk drive inside: It’s a 8 TB Seagate Baracuda ST8000DM004, and according to this post, it is a drive using SMR. So two strong indications that SMR is at play here, resulting in an abysmally slow overall write speed for 8 TB of data in 50 GB file chunks of just 80 MB/s. In the first 2 hours of the process, the data rate was 146 MB/s, so the drive can omit the re-writing of existing data caused by SMR for a while. However, at some point it has to admit defeat and start re-writing. So my perception that the drive was faster initially is nicely confirmed here.
As a result of these tests I decided to buy yet another disk drive, because my 8 TB drives I used so far are too slow for the amount of data that I need to back-up. So I went for a 16 TB Seagate Ironwolf with a production date of January 2025 and a separate USB to SATA casing, as I didn’t want to buy ‘a pig in a poke’ anymore. And here’s how that drive performed:
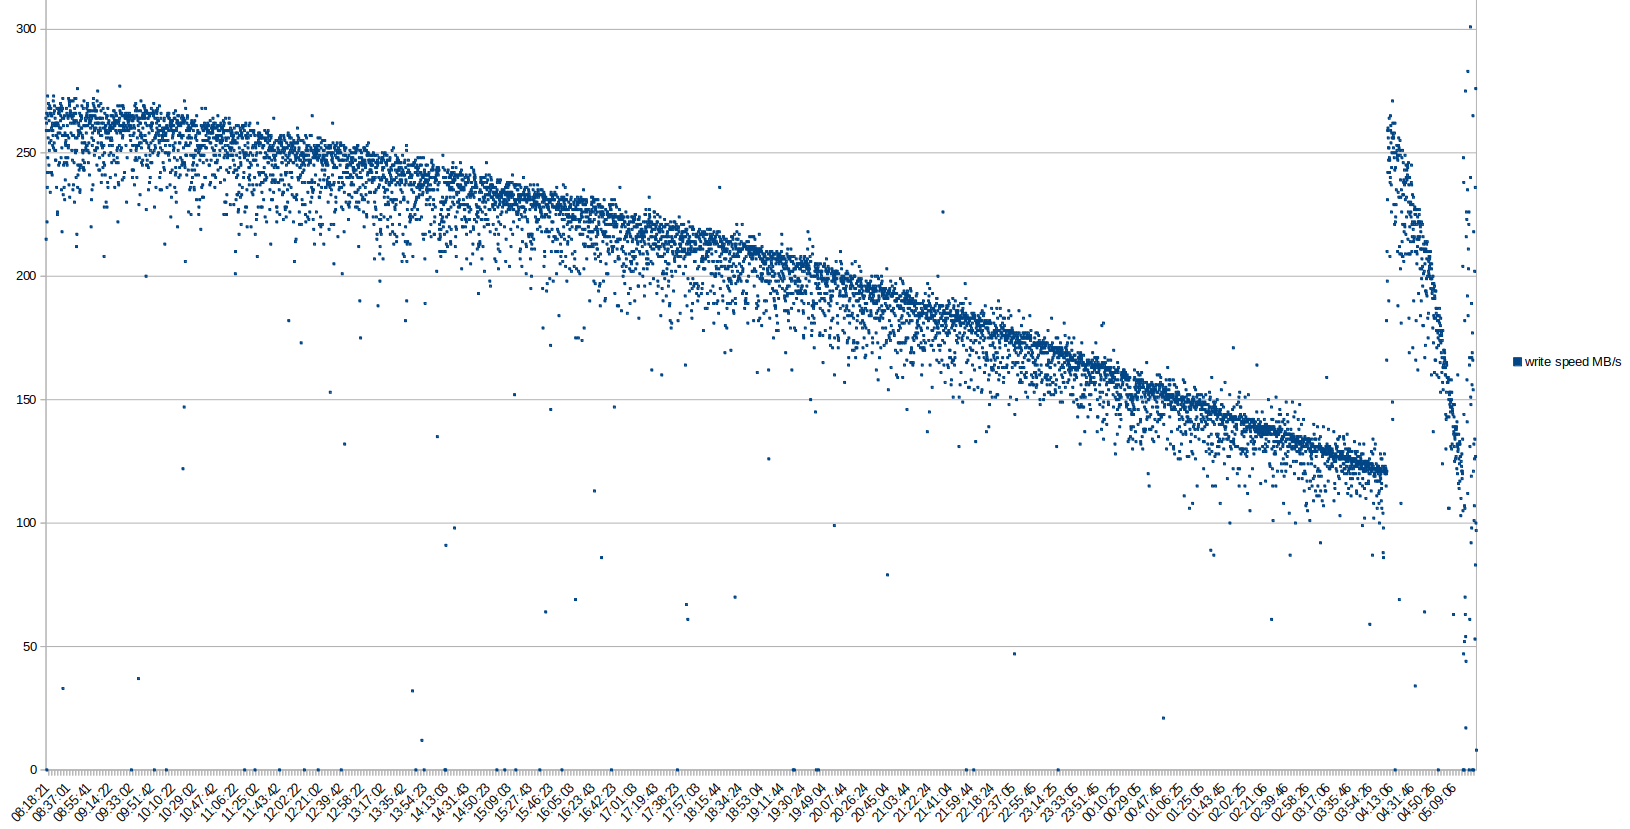
The graph looks very similar to the first graph in this post of the 20 TB disk drive. Write speeds peak at around 240 MB/s and slowly decrease to around 120 MB/s, with a spike again towards the end. Overall speed for writing 16 TB of data in 50 GB file chunks to the drive was 198 MB/s, i.e. a bit faster than the overall write speed of the 20 TB drive above. Note that even at this average speed, it took 21 hours to fill the drive.
Writing 50 GB files to a disk drive is not my real use case, but I started here to get a general idea of how fast the drives would be when writing large chunks of data sequentially until the drive is full. My real use case is writing large virtual machine snapshot files in the order of more than 50 GB a piece to the drive, a large number of smaller files like images in the 2-3 MB range and a huge amount of smaller document files. The disk read and write performance for such a workload is likely different, i.e. slower, and I will have a look at that as in one of the next posts. Before I go there, however, I will first describe how I produced the data for the charts above and how fast I can read the 50 GB files I’ve written to the disks. Lots more to come on this topic 🙂