 After moving from Typepad to my own WordPress installation, search engines haven’t yet caught up with the change. As a consequence most of the traffic is from regular readers who have updated their bookmarks and RSS feeds after reading about the move from the old site. So before traffic referred to my blog by search engines is increasing I made a snapshot of current statistics to see if regular readers use a different mix of browsers, operating systems and connectivity.
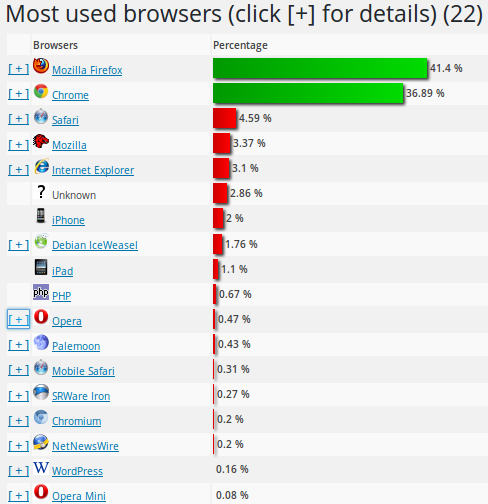
Browsers
The first interesting data point is that almost nobody uses Internet Explorer. Firefox dominates the statistics with 41%, followed by Chrome with 37%. Safari is next with 4.5%. Have a look at the first screenshot on the left for other browsers that also made it into the top 20. I was a bit surprised that Opera is not higher in the list but after having a closer look I saw that Opera on Android identifies itself as “Chrome” towards the web server. I haven’t checked the desktop browser but I wouldn’t be surprised if was the same there.
Operating Systems
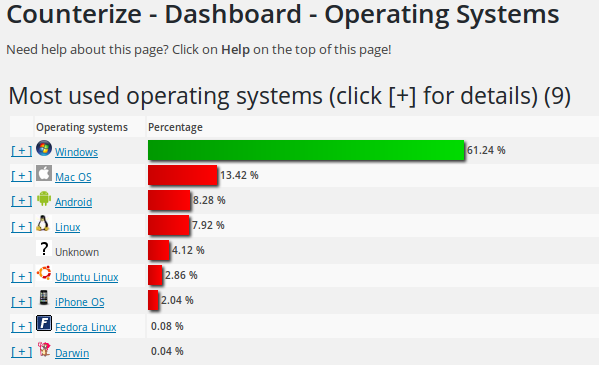 On the OS front, Windows dominates with 61%, followed by Mac OS with 13%. Linux and Ubuntu taken together account for an impressive 11%. I would expect that once traffic from search engines sets in, that number might decrease. Let’s see. Another interesting data point is that most people seem to read this blog on the PC, Android only accounts for 8% while iOS comes in with only 2%.
Connectivity
And finally I had a look at the percentage of IPv6 use. It’s shockingly small, between 5% and 10% depending on the day. I would have thought that it is more by now.
I think reading blogs is a desktop thing.
Hm, I do most of my blog reading on my mobile with Selfoss – which is why I was surprised.
https://www.besthostnews.com/ipv6-adoption-grows-to-10-percent-celebrates-20th-anniversary/ confirms your IPv6 stats.