 After the line of my neighbor has been switched to a different port in the street side DSLAM and mine followed a couple of days later, I finally have a stable DSL line again. There are many factors influencing the maximum uplink and downlink speed that can be achieved over a copper wire and since I’m pretty much as far away from the DSLAM as is possible in the center of Cologne, I think my line characteristics and performance gives interesting insights of what’s possible in densely populated areas.
So how do I know that I am at the maximum distance to the DSLAM? Well, pretty simple, when I look out the window, there is a DSLAM right in front of my house. Unfortunately, that DSLAM serves the other side of the street and the streets behind it. My side of the street is served from a DSLAM several streets away. When I measure the distance on a map it’s about 350 meters away. When the line is electrically measured, line length is shown as 460 meters. In the plans, the line length is 500 meters. In other words, not absolutely ideal for high VDSL and vectoring speeds.
Nevertheless I am getting the full 100 Mbit/s in the downlink direction and 37 Mbit/s out of 40 Mbit/s that are possible in the uplink direction. For that line length I would say this is quite spectacular, so I guess I must have quite new cables with a good diameter and not much cross talk from other lines that run alongside it.
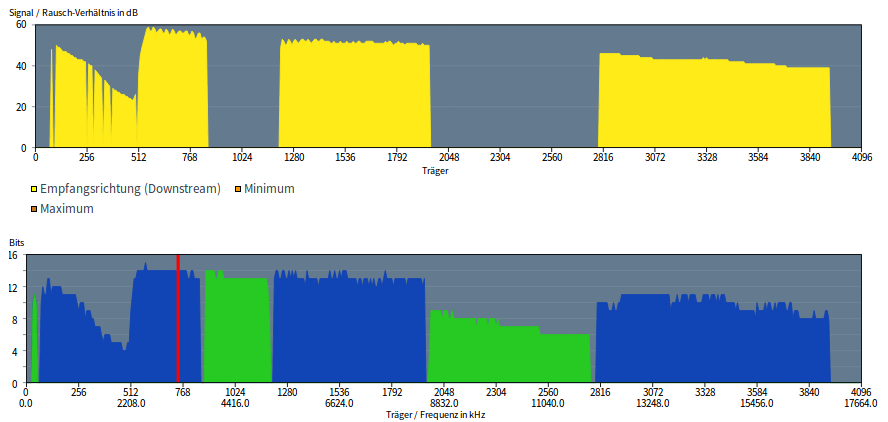
From the screenshot above, it can be taken that once super-vectoring is activated that promises 250 Mbit/s in the downlink direction and 40 MBit/s in the uplink direction, I could get another quite significant speed boost as the signal to noise ratio and modulation at the 17 MHz cut off point is still quite o.k. As it seems, however, super-vectoring will only increase the downlink speed while the uplink speed remains the same. 37 Mbit/s in the uplink direction is not shabby, it almost rivals what I get over my fiber line in Paris. However, since I run my cloud services from home, I would rather like to get the uplink increased as well.
So let’s see how this chart looks like if/once super-vectoring is activated and the channel bandwidth increases once again, this time from 17 MHz to 35 MHz.
Note: In the screenshot, the upper graph shows the downlink signal to noise ratio (SNR) while the lower graph shows the number of bits per sub-carrier, blue for downlink, green for uplink.