 We’ve had a visitor at our place recently for a couple of days who used a video streaming service quite a lot. When I had a look at our Internet connection usage statistics, I was quite surprised how differently the service behaved when it came to resource usage compared to the video streaming provider we use in the family. Yes, we only use one! Perhaps a generational thing. Anyway, when I had a closer look at the datarates of the two streaming services I was quite surprised that there is a 10:1 difference.
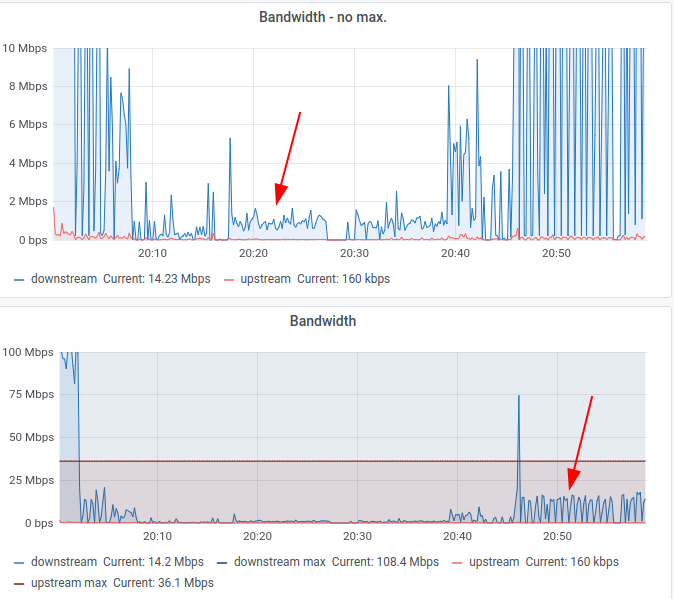
The screenshot on the top shows the difference quite clearly. The two graphs show the same downlink and uplink throughput values but on a different y-axis. The graph on the top is cut at 10 Mbit/s to show more details while the bottom graph shows traffic with the full channel bandwidth of 100 Mbit/s on the y-axis.
The arrow in the top graph points to the data rate of the video streaming service we use in the family on a PC. In other words, it’s SD or HD definition (probably the former) and the streaming data rate is around 1.5 Mbit/s. It’s so little that it’s hardly visible in the bottom graph at all!
The other video streaming service has left its marks in the left and the right part of the two graphs, the arrow at the bottom points to a typical spot. The datarate is easily around 12 Mbit/s on average. This stream also went to a PC so the screen resolution was also either SD or HD (probably the later). But even if the stream used a higher resolution I would still argue that the first streaming service does a far better job at compressing the stream.
There are also other factors that play a role such as complexity of the video material such as fast changing scenes and content. However, there were more of such scenes in the video streamed via the first streaming platform so that also can’t be the reason for this significant difference.
An interesting difference!
And in case you are wondering how I made the graphs: At the moment, I’m experimenting a bit with exporting the statistics from my Fritzbox DSL router to a database and a Grafana frontend. More about that in an upcoming post.