A few months ago, I moved my services such as this blog from a bare metal server in a data center in Finland to another bare metal server in France. One drawback of the move was that the bandwidth to the server is limited to 500 Mbps instead of the 1 Gbps the network interface could provide. And indeed, the data center operator does enforce the 500 Mbps limit in the downlink direction. Recently, I wondered how that is actually done in practice and had a closer look with Wireshark. As you can see above, the result is quite interesting!
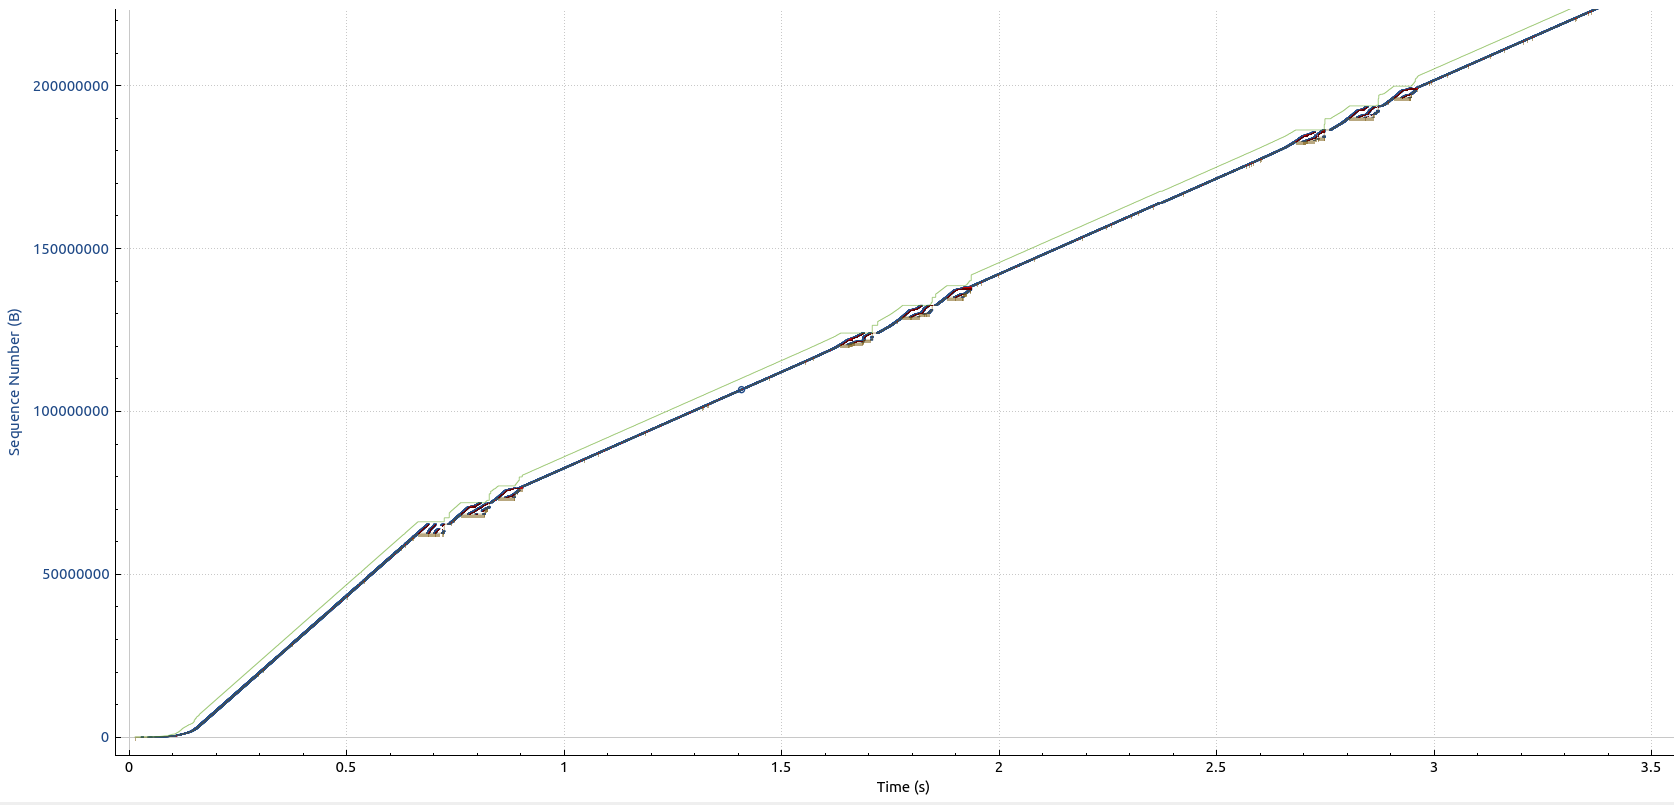
The graph above shows the Wireshark TCP sequence graph of an iperf3 TCP downlink throughput test I ran on a virtual machine in a Hetzner data center in Germany from a virtual machine running on my bare metal server in a French data center with TCP BBR activated instead of CUBIC. At the beginning, no bandwidth shaping or throttling was applied. One can see the TCP slow start mechanism doing its work for perhaps 200 ms when the transmission starts. After that and until around 700 ms into the data transfer, the data rate is around 800 Mbps.
At the 700 ms point, throttling starts to set in. This is done by discarding packets that then have to be retransmitted. TCP BBR doesn’t much care for missing packets and happily keeps going until the TCP receive window is full. This happens rather quickly, as the bytes in flight (blue line) rapidly meet the receive window size (green line). To have a better look, right click on the graph above and open it separately in a new browser tab for a version in full resolution.
The screenshot below shows the TCP receive window scaling graph for 10 seconds. The x-axis is time again, while the y-axis shows the TCP window size that is available for unacknowledged bytes in flight (green line) and the number of outstanding bytes not yet acknowledged (blue line). When throttling is applied, packets are thrown away and the number of outstanding bytes pretty quickly meets the window size. The sender then stops transmission, until there is room again in the window. This then keeps repeating about once per second and the resulting data rate is around 500 Mbps as advertised.

So far, so good. In the next post, I’ll have a look at how these graphs look like when I do the same exercise from my fiber line at home.