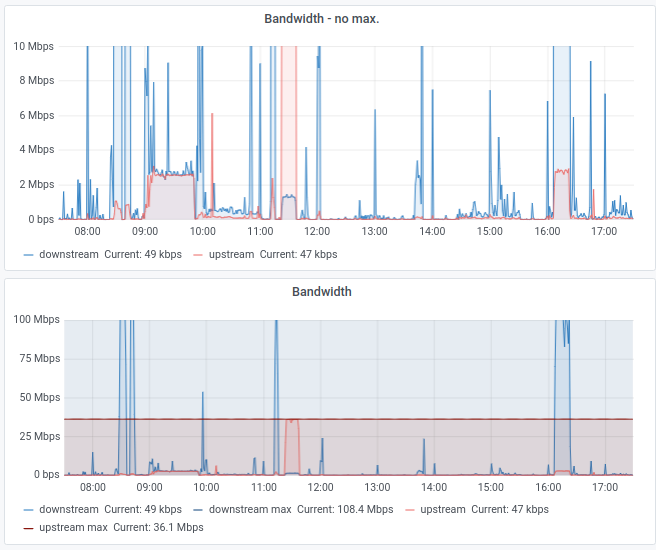
For today, I have a screenshot of two bandwidth graphs of a recent working day at home which shows the different applications I use Internet connectivity for. As in the previous blog entries on the topic both graphs show the same timeframe. While the bottom graph shows the complete downlink channel bandwidth of 100 Mbit/s in the downlink direction and 36 Mbit/s in the uplink direction, the upper graph is capped at 10 Mbit/s to show things in more detail.
Data In – Data Out – Videoconferencing – Software Updates
On this particular day I downloaded several gigabytes of data I needed for my work at around 8:30 in the morning. From around 9 to 10 I participated in a video conference that used a bandwidth of 3 Mbit/s in each direction. Towards the end of the call I switched on another computer which used the opportunity to download a massive software update. There was some activity between 10 and 11, probably an audio-only call or conference of some sort, perhaps by another member of the family. I don’t recall.
At 11:30 I was done with some work and uploaded the resulting 3 GB archive to a server. This took around 15 minutes at my full uplink line rate of 36 Mbit/s. After that, things were quiet on the line until around 2:30 pm and another round of audio-only calls. At around 4 pm in the afternoon when I downloaded another multi-gigabyte archive at the full line rate of 100 Mbit/s. At the same time I must have been on a video call as there is more traffic in the uplink direction than was generated by the TCP ACK packets of the download.
The Grand Total Of A Day
Obviously I also browsed the web every now and then during the day and wrote and received lots of emails with attachments. However, such activity doesn’t even show up in the graph as the amount of data transferred is so small compared to voice and video streaming and the big data transfers. On an average working day my statistics show around 7 GB in the downlink direction and 3 GB in the uplink direction. Sounds a lot but people with kids at home and subscriptions to several streaming services probably laugh at that number.
Do I Really Need a 100 Mbit/s Line?
So far so good. Now when you look at the graphs you might wonder if I really needed a 100 Mbit/s line. Most of the day, it is totally underutilized. True, but let’s say I only had a 10 Mbit/s line. Just imagine how the graph would look like then. While the video conference calls would have worked just fine on their own, the massive data down- and uploads would have taken much longer to complete. In other words, I would have had to wait much longer until I could have started working and the other end would have had to wait much longer until they had received the result. Also, when fully utilizing a line, the round trip delay times usually grow quite significantly, which is a problem for video conferencing. Also every now and then I transfer even more massive amounts of data. When I recently set up a new VM server, I downloaded 50 GB of VM images a single swoop.
So I would argue that a 10 Mbit/s would have slowed down my working day significantly. I would even argue that waiting 20 minutes for data to download like today is not ideal. I’d definitely know what to do with a faster line.
Oh, and perhaps you noticed the download spikes at each full hour. These are generated by a script that measures throughput once an hour of one of my servers in the cloud.