One thing I wanted to have for a long time was a better visibility of how my DSL line at home is utilized over time. My Fritzbox router has some basic functions for this such as showing the uplink and downlink utilization of the past few minutes and a daily, weekly and monthly traffic counter. That’s a start but the amount of information is limited and so are the conclusions that can be drawn from it.
Beyond these features, however, the Fritzbox has a number of counters that are updated every few seconds which can be queried over the network. Sounds promising! Together with the Grafana visualization suite that I also wanted to have a closer look at for quite some time now, it made for an interesting project. So I started searching a bit and found out that a number of other people have been at this point before as well and have put together a complete data collection and visualization front-end for the information provided by the Fritzbox. Perfect, exactly what I was looking for!
The Setup
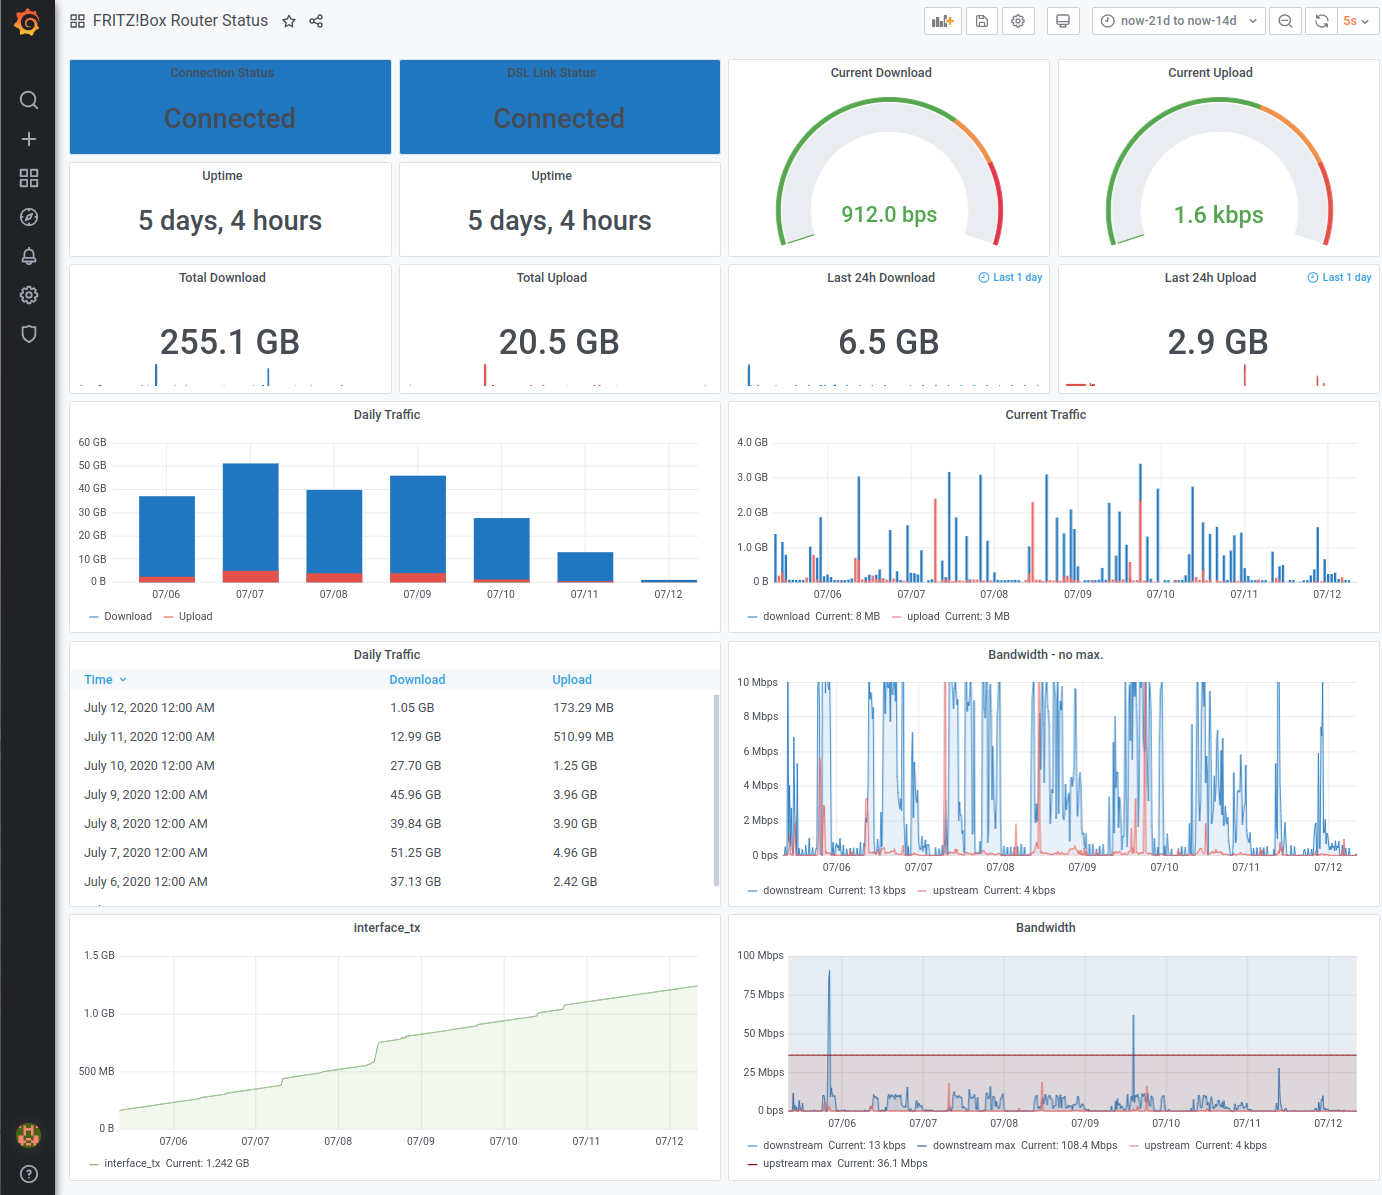
The article linked to above is in German and those who speak the language will find step-by-step instructions of how to set up a system that collects and stores the data provided by the Fritzbox in an InfluxDB database and Grafana to visualize the data. Instead of a Raspberry Pi as per the instructions above, I installed the system in a virtual machine that runs on my VM host at home. The screenshot above shows the counters provided by the setup and I extended the visualization with an extra graph at the bottom left that caps the x-axis at 10 Mbit/s instead of the full 100 Mbit/s line rate to better see ‘low bitrate’ data streams. As all counters are stored in a database it is possible to go back to arbitrary times in the past and have a closer look at how the line was used. This gives very interesting insights from a network traffic point of view, like the one I talked about in a previous post. More insights to come in number of future posts.
How Data Flows From the Fritzbox to Grafana

I’m glad that I didn’t have to put this monitoring system together on my own as it involves quite a number of components as shown in the data flow graph above:
- The Fritz box on the left side is queried every few seconds by a Fritzbox specific plugin of ‘Collectd’, a generic server daemon that periodically queries data on other systems.
- Collectd forwards the data it receives from the Fritzbox to an InfluxDB database.
- The Grafana visualization system in turn connects to the Influx database to get its raw data for visualization when I point my web browser to the visualization page.
Note: The numbers in the data flow graph above are the TCP ports used by the different components. In my case, all components are on the same virtual machine, but since they communicate over TCP, they could also be distributed.
A First Analysis Based on The Screenshot Above
The screenshot at the beginning of the graph shows the data traffic over my DSL line over the course of a week. As we had a guest that week who streamed a lot of video, the line was quite busy and around 50 GB of data were transmitted every day which accumulated to well over a quarter of a terabyte of data that week. When seven days are shown in the graph, one only sees general trends. But it is possible to zoom into any time frame since I started recording and as data is collected every 10 seconds this delivers a wealth of other interesting insights. To be continued, so stay tuned.