 As a quick follow up to my previous post here’s a quick thought about how despite working on that terabyte per month data use, it is still ridiculously low when looked at from an overall line capacity point of view.
At home I have a a 100 Mbit/s DSL line in the downlink direction and 40 Mbit/s in the uplink direction. If I fully used my line at all times, I would be able to transfer around 32 TB per month in the downlink, or 1 TB a day:
100 Mbit/s / 8 (bytes) * 60 seconds * 60 minutes * 24 h * 30 days = 32400000 MB = 32400 GB = 32 TB.
Last month, I transferred 375 GB of data in the downlink direction (0,375 TB). This sounds like a lot but it’s actually only 1,17% over the theoretical maximum. In the uplink direction I used about 2.6% of the available line capacity.
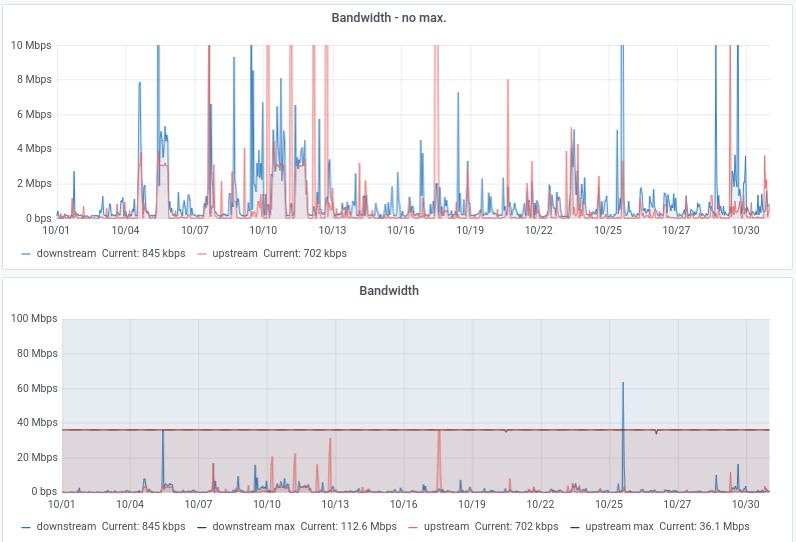
The image above shows these values in a graphical way. Both graphs show the same link. The upper graph is capped at 10 Mbit/s, so slower data transfers become more visible. The lower graph uses the full downlink/uplink line rates on the y-axis. It’s important to realize that both graphs average the downlink / uplink data rates over many minutes for each dot. That means that especially the lower graph does not show spiky peak throughput use well. For example, downloading 100 MB of data at 100 Mbit/s would only create a tiny average spike. To see how often the full line rate is used one has to zoom in to the 15 or 30 minute view. As always, be careful how you interpret a graph!
And yes, even though my line utilization is so low, I’d still go for a speed upgrade if I could get a faster uplink line rate. In practice it is a big difference if I could transfer a file in 10 seconds rather than a minute.