In part 1 of this series, I compared how the TCP throughput graphs look like for a VDSL vs. an LTE link in stationary and mobility scenarios. Recently, I’ve been to Belgium for a few days and I was expecting to see pretty much the same LTE throughput behavior as in my home network. But it turned out that the graph looks entirely different there.
While I was in Belgium, my stationary scenario was in a location with relatively week signal strength, around -102 dBm. As it was pretty much in the countryside, I was limited to two LTE carriers, one on band 20 and one on band 3. As a reference, here’s a graph in similar network conditions in my home network in Cologne:
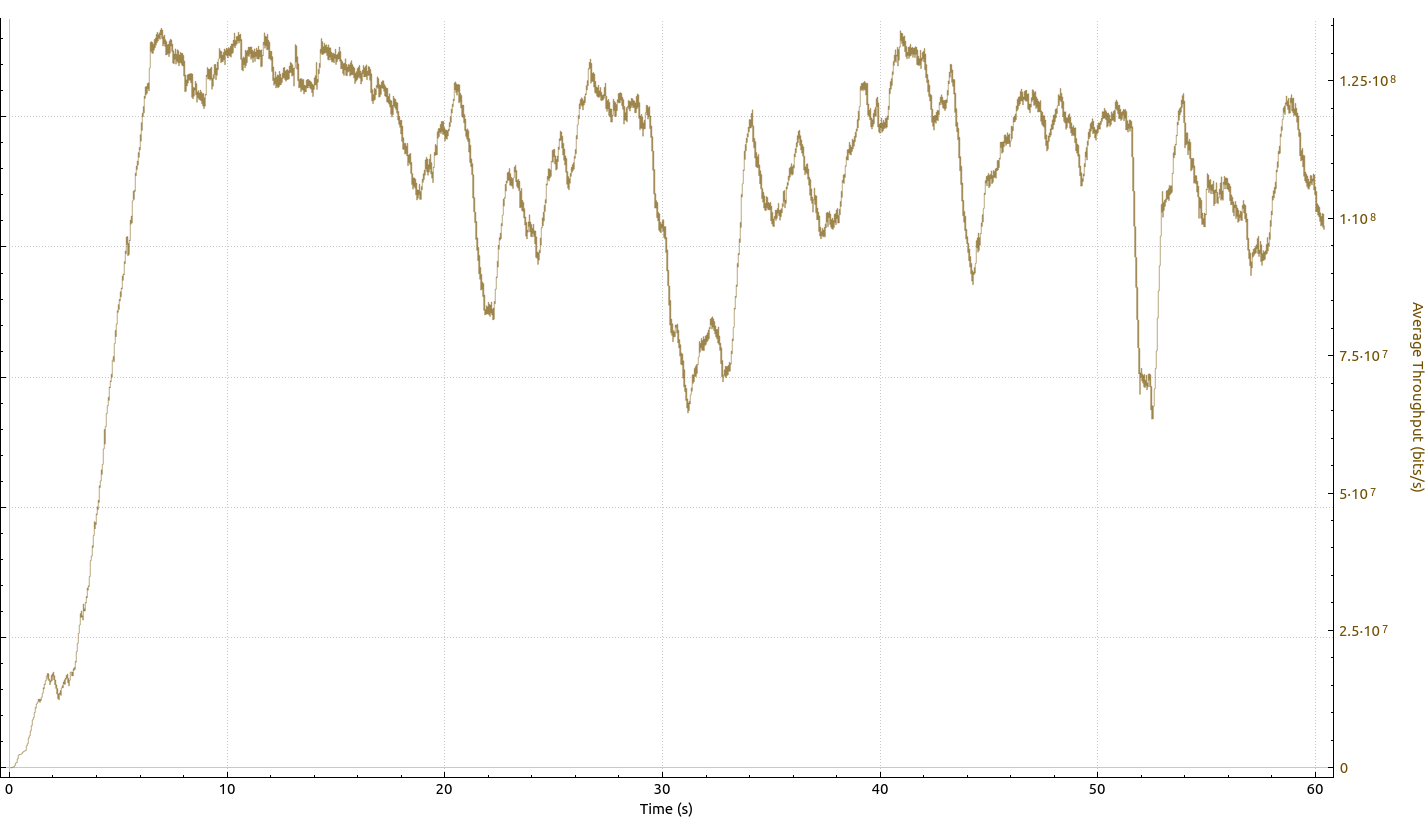
To me, this looks like a nice curve. I had 4 LTE carriers with low signal strength, and most of the time, throughput was well beyond 100 Mbit/s with only a few dips down to 75 Mbit/s.
And here’s the graph in the Belgian network I used:
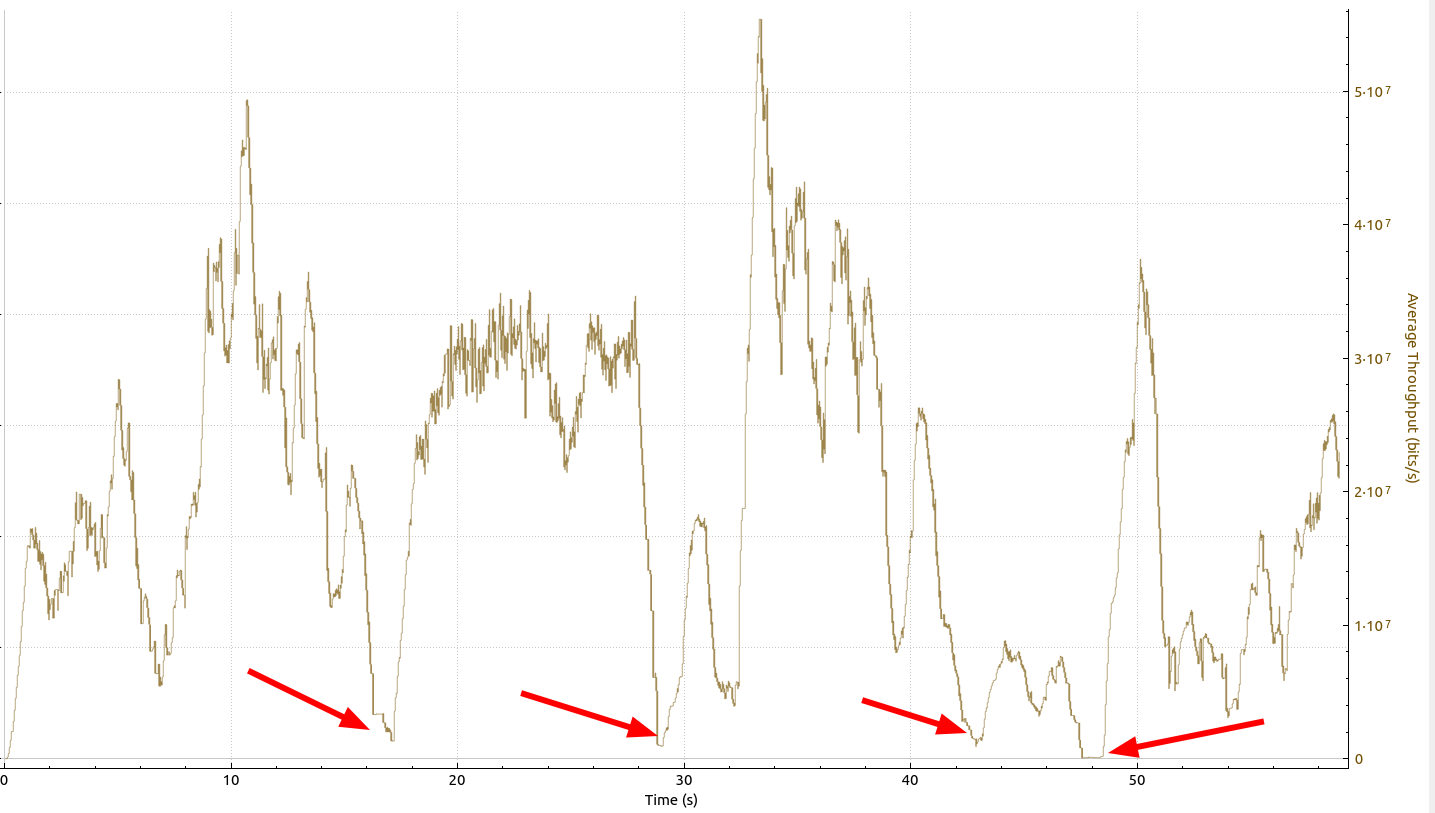
As I only had 2 LTE carriers available and there was considerable load on the network, peak throughput is much lower. No surprise there. But what I find very strange are the frequent dips to a few single digit megabits per second and the short, steep peaks. That can hardly be explained with changing load conditions. When looking at the sequence chart, this is not caused by packet loss either. This behavior occurred over all days I was in Belgium and also in areas with much better signal strength. Unfortunately, I didn’t have the time to compare the behavior of another network. But definitely something to follow-up on when I’m abroad again next time.