After the interesting experience of chasing packet loss issues of my fiber router in Paris and learning about different TCP congestion control algorithms in the process, I wondered how TCP handles changing network conditions in wireless networks. After all, especially when on the move, air interface conditions and general load of the cell changes all the time. So how does that look like on the TCP/IP level? To find out, I made a number of throughput tests and generated graphs from the data dumps that show different scenarios. As a baseline, I first made an iperf3 downlink throughput test over a Wi-Fi link and a fixed line VDSL backhaul. Here’s how the throughput looks like:
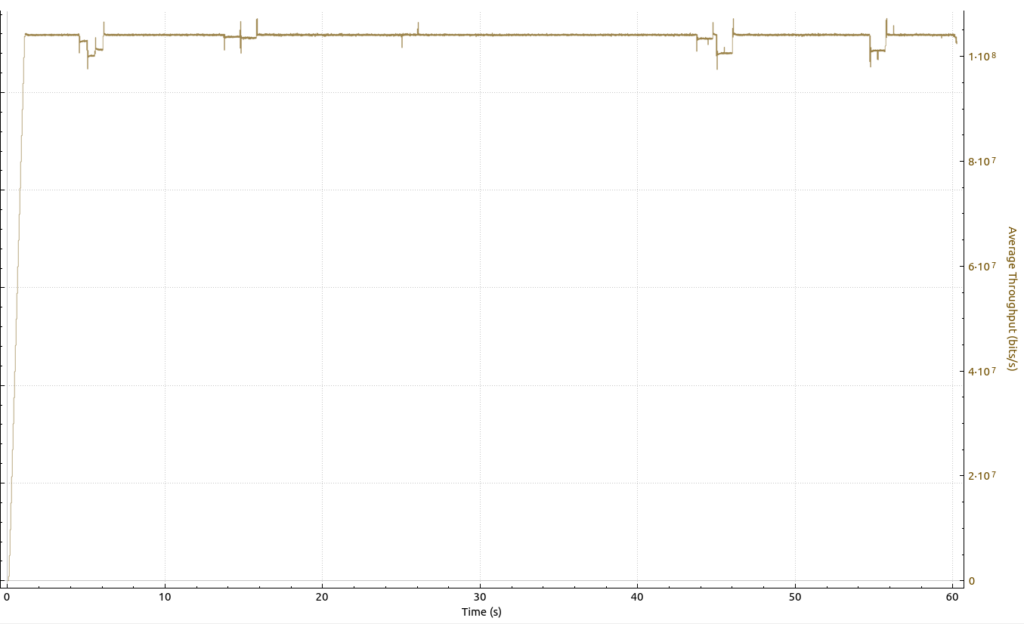
The graph is pretty much flat at around 100 Mbps with a few minor wiggles, which is what I expected to see from a fixed line and completely uncongested link.
Now let’s have a look how the same download looks like over an LTE connection, again with Wi-Fi as the last hop in a stationary, i.e. non-moving setup:
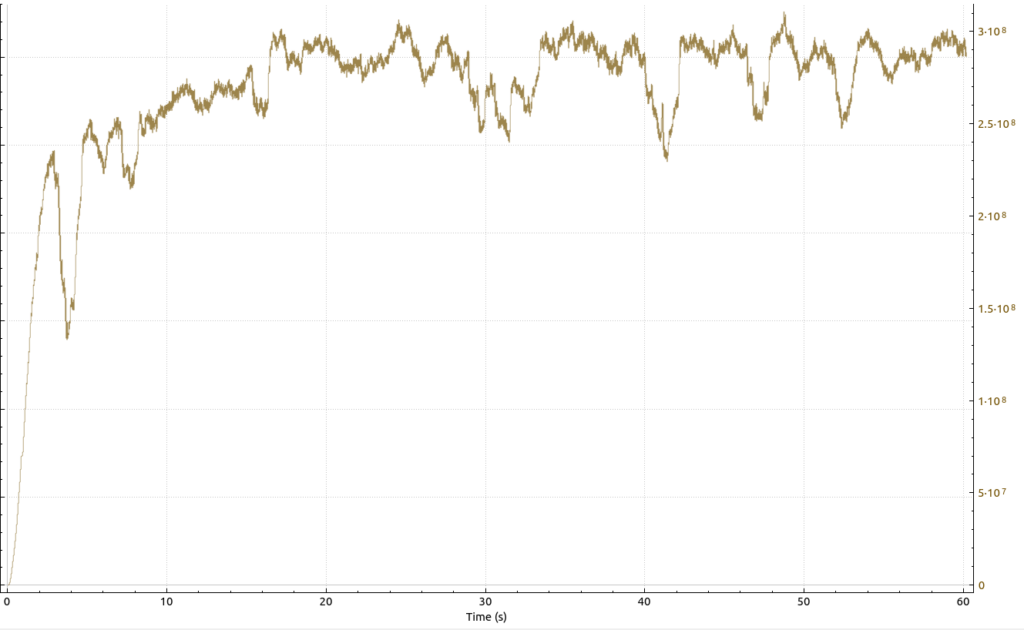
Even though the scenario is stationary, throughput varies a bit, between 250 and 300 Mbps. I attribute the fluctuation mainly to the varying load of the serving cell and the interference from varying load of neighboring cells, as there was no mobility and I was also not close to the test setup, so my presence or movements would have altered the radio field.
And now to the really interesting part: Throughput while sitting in a moving train. Here’s how that looks like:
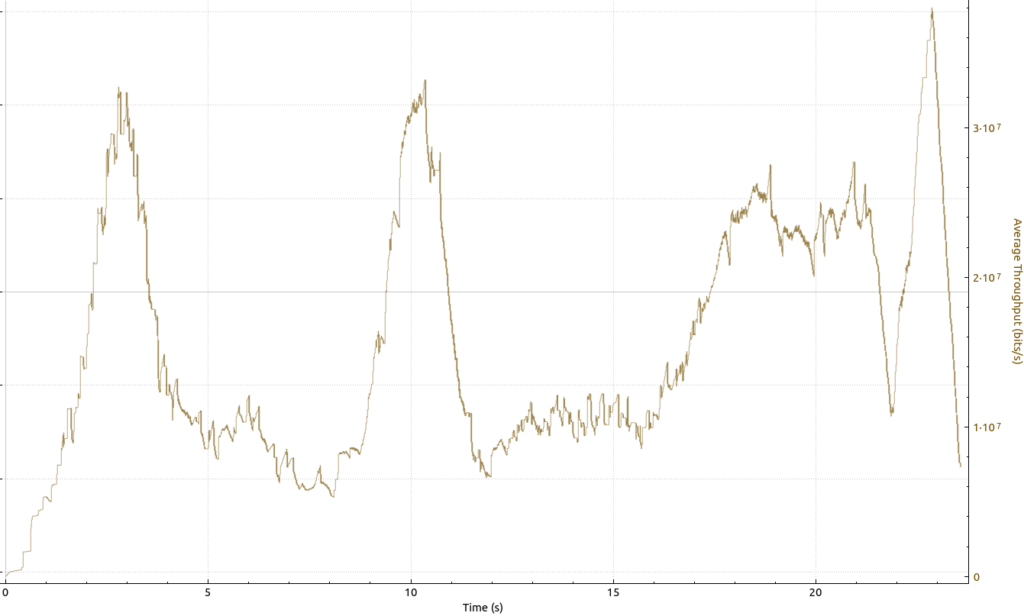
In the 30 seconds measurement window, throughput significantly varies between 10 and 40 Mbps. This made me wonder if there is a lot of packet loss at the steep cliffs between higher and lower throughput!? Here’s the TCP sequence graph that gives the answer:
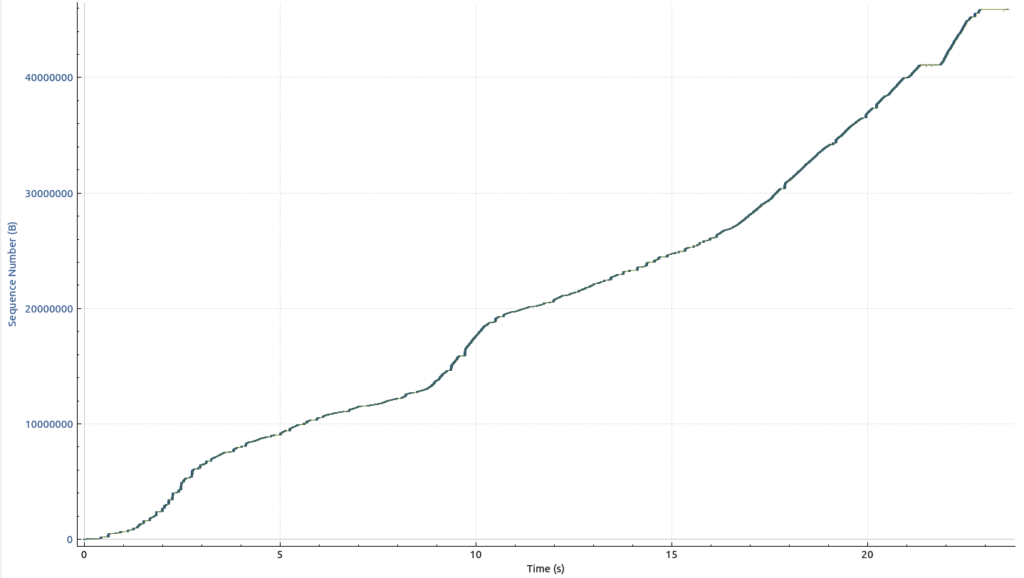
In an ideal data download, the line would be pretty much straight from the lower left to the upper right. But due to the varying speed, the curve is flatter in places with lower throughput and much steeper when throughput increased for a few seconds. Red lines or dots would be visible in this graph if there was any serious packet loss. But apart from the normal packet loss that is quickly recovered, there is nothing in this graph that would point to significant packet loss when the signal conditions suddenly changed significantly. This means that the routers in the network did a good job of buffering packets when the channel suddenly changes, and the server on the network side does a good job of throttling itself when the channel becomes narrower.
I wasn’t sure what to expect on the mobility case but the TCP sequence graph looks much smoother than I had anticipated. Nice!