If your web services run in Docker containers behind reverse proxies, you can of course run a tcpdump / Wireshark trace on the physical Ethernet interface of your server, or on the virtual Ethernet interface of the virtual machine your containers run in. That’s nice, but it only gives you the encrypted https traffic. So if your http server logs are not enough for debugging, it would be really nice to get to the unencrypted http traffic.
There are methods to forward the encryption keys from web browsers and servers to Wireshark, which will then do the decryption for you, but that’s a bit inconvenient. So let’s look for something that is easier to do: If you run your web services in containers behind a reverse proxy, it’s possible to remotely trace the decrypted requests via Docker’s virtual bridge interface to which the web services are connected to!
This works, because the web server acts as a front end (i.e. as a reverse proxy) and thus as the https termination point. Here, the https requests are converted into unencrypted http requests and forwarded to the web service containers that are connected to the same virtual Ethernet bridge.
On the Docker host itself, there are usually several virtual bridge interfaces. To find out to which one the reverse proxy and the web service containers are connected to, one can use the following command:
docker network inspect CONTAINER_NAMEThis will give you the virtual network interface(s) and IP address(es) / range(s) used by the container. The next step is to get the bridge interface name:
ifconfig | grep brThe ifconfig command above shows a list of all bridge interfaces, their names, and their IP address ranges. And with that info, you can now run a remote tcpdump session and forward the bridge traffic to Wireshark running on your notebook:
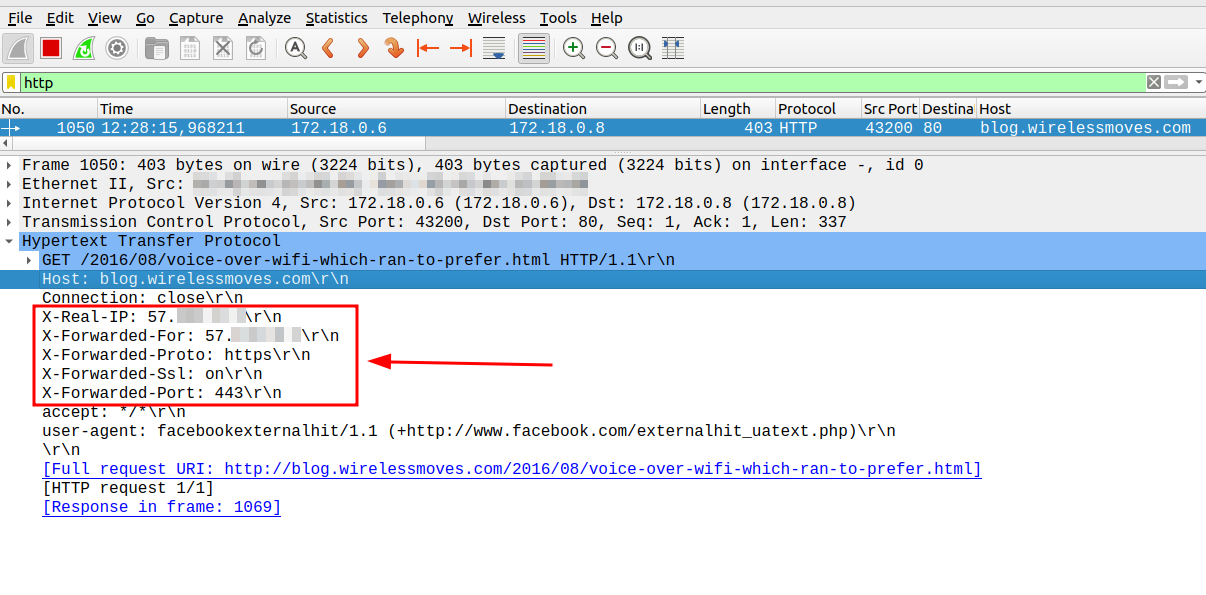
ssh YOURSERVER 'sudo tcpdump -n -i br-AAAABBBBCCCC -s 65535 -w -' | wireshark -k -S -i -As you can see in the screenshot above, the reverse proxy doesn’t only convert from https to http, but also includes information that is lost in the process into http X-headers, so the web service can still get to information such as the public IP address of the client. Nice to see this in an actual trace!
Bonus: The trace on the bridge interface does not only show the traffic from the proxy to your web service containers, but also the traffic to and from the Internet to the reverse proxy. So you have the encrypted and the unencrypted version of the request in one trace. On top, you can also spot that the reverse proxy caches quite a number of pages and delivers them itself rather than forwarding requests for pages that have not changed to your web services.
And there we go, happy tracing!