These days, I use my server based instance of OnlyOffice in combination with Nextcloud more often than the locally installed LibreOffice. The main reason is that I edit many documents on more than one device, so having them on my own server and to be able to edit them from anywhere is a game changer. Also, OnlyOffice’s Word, Excel and Powerpoint compatibility is significantly better than that of LibreOffice to the point that it is almost perfect. One little thing that was missing so far, however, was the use of extra fonts that are not included in the package. Unfortunately, that is sometimes necessary when I get documents from other people that are not using standard and free fonts. On my notebook, adding fonts is simple: Just copy them to a certain directory and it’s done. Turns out that the same approach also works very nicely for a dockerized OnlyOffice on the server.
Continue reading OnlyOffice Online: Adding FontsVisualizing Voice Packetization – OTT Voice Observations – Part 2

In part 1 on this topic, I’ve done a first high level comparison of how the Signal messenger app and the Conversations messenger app use WebRTC for real time voice calling. In that post, I showed that Signal packetizes the voice channel in 60 ms chunks while Conversations uses a packetization of 20 ms. The two graphs in this post show how this can be seen with the help of a Wireshark trace that I took on my Wi-Fi router at home.
Continue reading Visualizing Voice Packetization – OTT Voice Observations – Part 2Signal vs. Conversations – OTT Voice Observations – Part 1

In my simple universe, I always thought that all apps using Android’s built-in WebRTC stack for voice and video calls would pretty much use the same parameters and hence, the encrypted data stream would pretty much look the same. It turns out, however, that this is not at all the case. This discovery made me go off on quite a bit of a tangent, and I decided to have a look at a number of different related things, including cellular network handover behavior and other things. But let’s start at the beginning, the use of WebRTC by different ‘Over the Top’ voice applications. Personally, I use two messengers: Signal and Conversation and it turns out they use WebRTC quite differently!
Continue reading Signal vs. Conversations – OTT Voice Observations – Part 1Disconnecting Mouse Moves
Here’s yet another ‘mouse’ story, these devices seem to be much more tricky to handle than they look, at least for me. So here’s the story: For the past few years, I’ve had this very strange behavior that when traveling, my mouse would work better on some surfaces than others. Particularly, when I would lift the mouse, move it and then put it down again, it would, on some surfaces, take a few seconds before it was working again. For several years I blamed this on the reflectance of the surface, as this behavior seemed to mostly happened on such surfaces. But over the years doubt has crept in if that was the real reason for this.
Continue reading Disconnecting Mouse MovesMy AI Learning Journey – Part 12 – Kagi’s Privacy Minded LLM Search Assistant
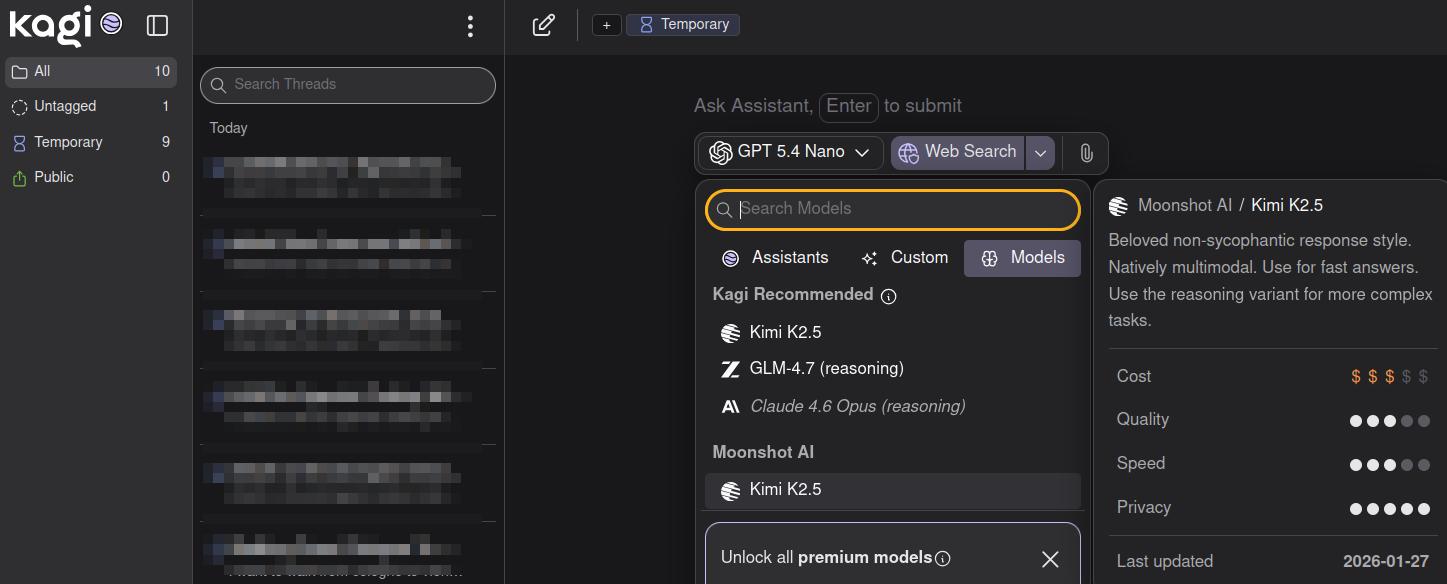
In a previous post I’ve taken a look at how I can combine a private LLM with Internet search. My setup: An Open WebUI instance hosted at home together with Ollama, the Llama3 LLM and Brave as a search front-end. While this works well for some kinds of searches and not so well for others, I was wondering if there are also other options for private search with LLM capabilities that require less self hosting. Here’s an interesting option I came across: Kagi.
Continue reading My AI Learning Journey – Part 12 – Kagi’s Privacy Minded LLM Search AssistantWorking on the Train Like its 1988!
When I use public transportation to commute to work today or when I take longer trips with the train, every second person on the train seems to have a notebook open in front of them, while the other half interacts with their smartphone or tablet. Its 2026 after all. I’d like to think of myself as a pioneer of doing this because I used my notebook with a mobile Internet connection on a train a decade before it became popular. But actually, I’m a later adopter…
Have a look at the first 5 minutes of this Youtube video with a recording of a Beyond 2000 episode broadcast in 1988 about working and communicating on a train 40 years ago. Truly amazing then and truly amazing how far we have come since then.
My AI Learning Journey – Part 11 – AI Assisted Coding – Good or Bad?
In the previous post I’ve had a look at how I can integrate an LLM into my programming environment and use a prompt to produce and modify code, to find bugs and security issues, and to discuss options and fix issues. I find the result stunning. So is AI assisted coding a good or a bad thing? Maybe this is the wrong question to ask, it’s like wondering if programming in Python is a good or bad thing compared to programming in assembly language. Let’s dwell on this a bit.
Continue reading My AI Learning Journey – Part 11 – AI Assisted Coding – Good or Bad?My AI Learning Journey – Part 10 – AI Assisted Coding – VSCodium and Continue
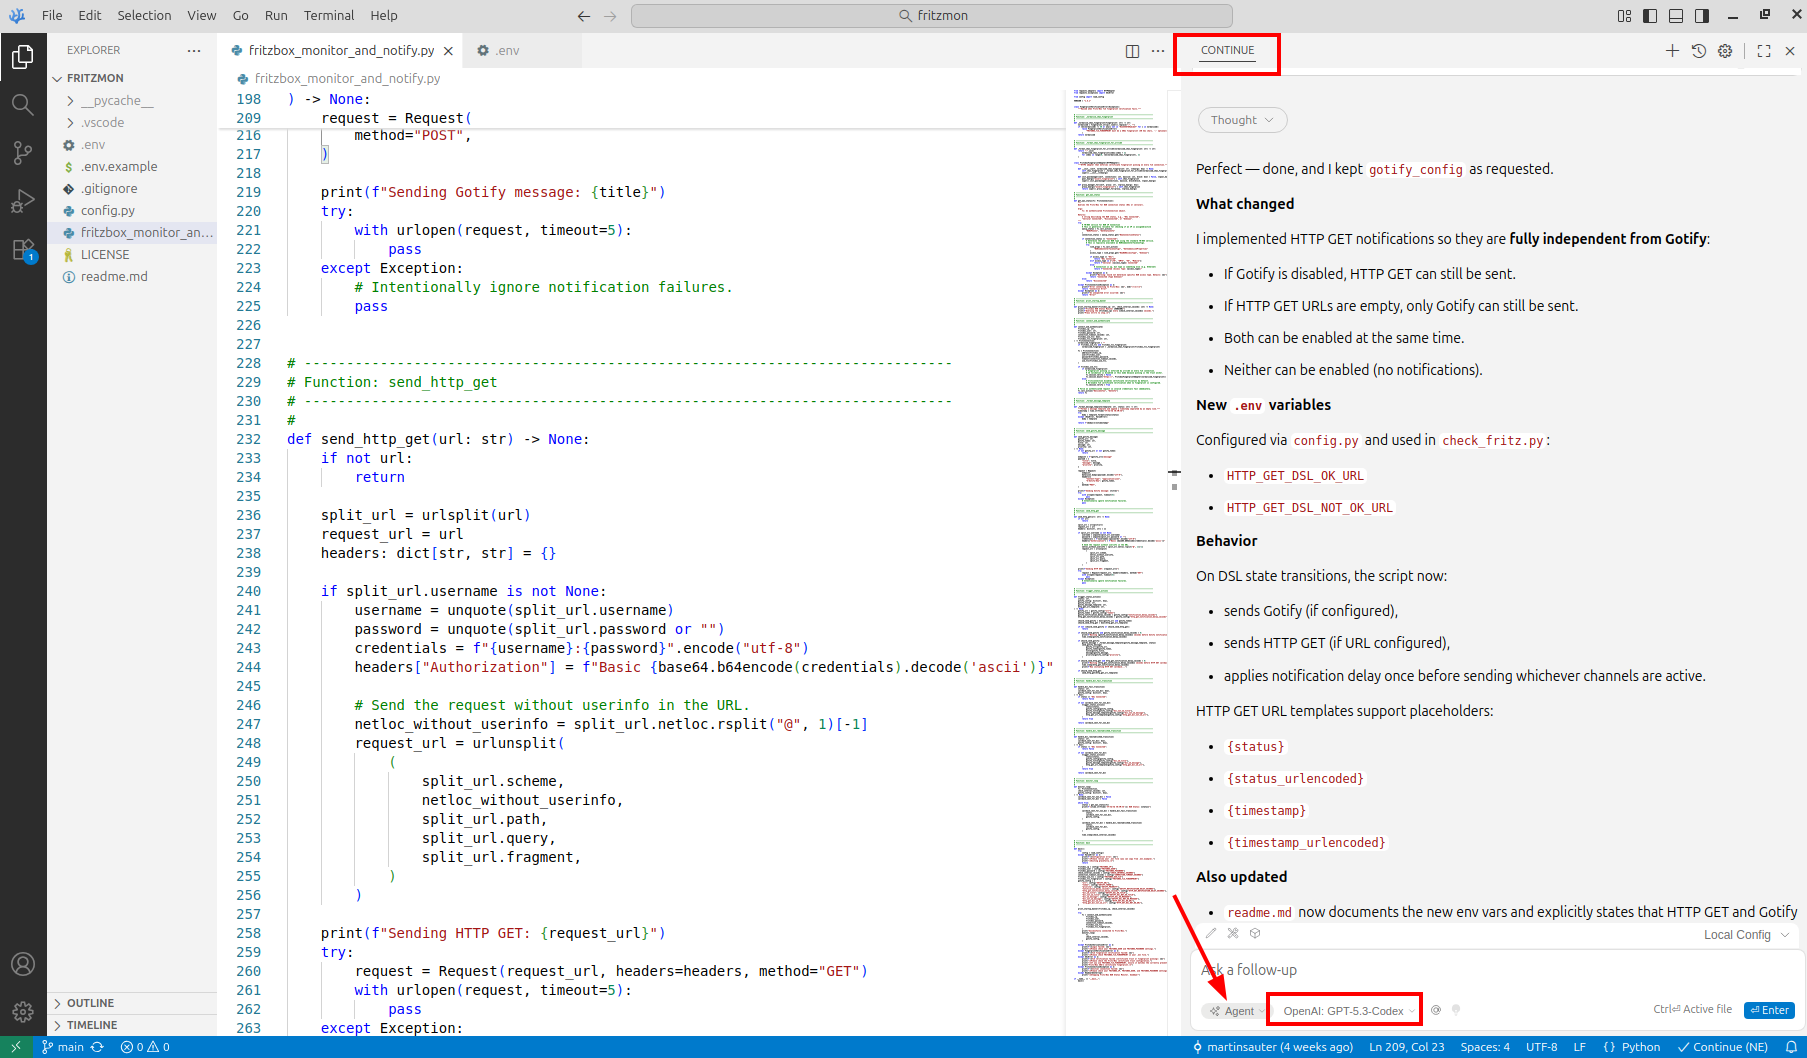
All right, I’ve touched quite a few topics in my AI learning journey so far and today it is time to have a look at a central piece of the whole exercise: AI assisted programming.
Over the past years, I’ve been using AI systems in my private programming projects a few times but it has always been separate from the programming environment and I had to copy and paste code at some point. And while this has sped up quite a number of things, it always felt quite limited. In the meantime, it seems that a number of plugins for programming environments have become available to enable LLMs to directly interact with the code. Also, I’ve heard that high end LLMs can get an overview of the complete code base of a project and suggest + implement solutions across many source files at once. That sounds all quite nice but I was not willing to give up the privacy of my tool chain and I also didn’t want any tool to create a personal profile of my activities. So I looked around a bit and came across a very nice tool chain that fit my privacy needs while giving me access to the latest LLM models for programming.
Continue reading My AI Learning Journey – Part 10 – AI Assisted Coding – VSCodium and ContinueMy AI Learning Journey – Part 9 – Local Documents and LLMs
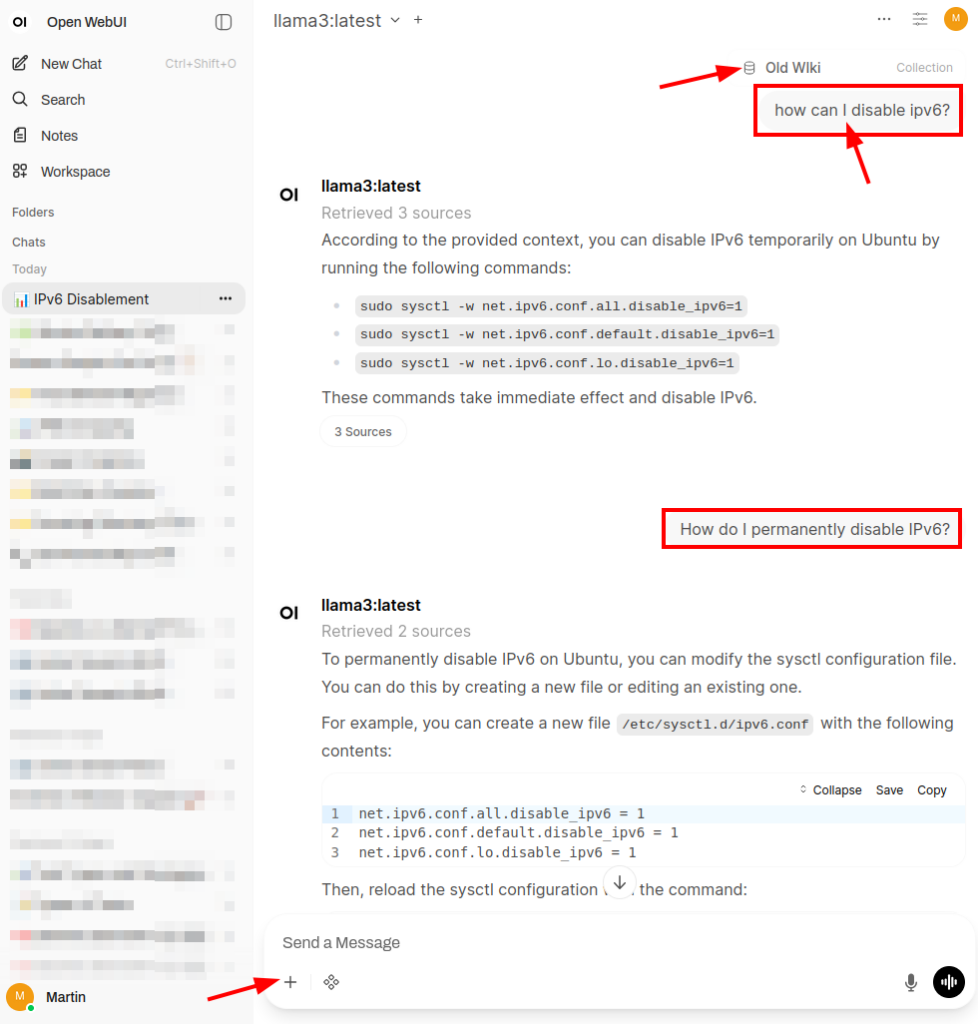
In part 7, I’ve had a look at how external search engines can be integrated into Open WebUI and combined with local LLMs to get external references when asking questions instead of having to rely just on the output of the LLM. This is referred to as Retrieval Augmented Generation (RAG). The same approach can also be used to combine local LLMs with local documents for search.
Continue reading My AI Learning Journey – Part 9 – Local Documents and LLMsMy AI Learning Journey – Part 8- OpenRouter – 350+ Models to Experiment With
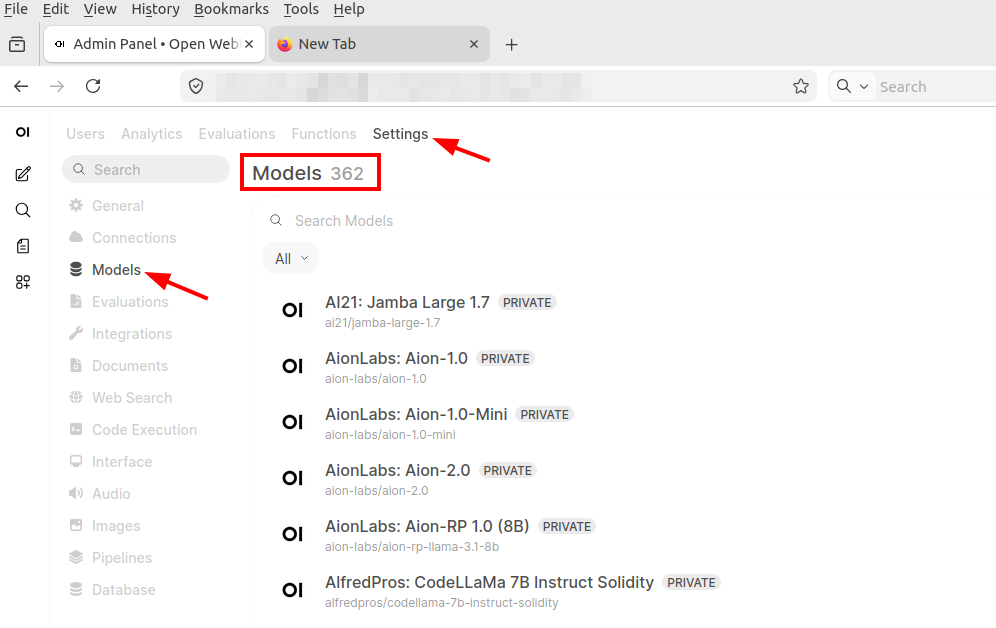
After looking into local LLMs and Retrieval Augmented Generation (RAG) in the previous post, this post focuses how to experiment and use public LLMs in a privacy friendly way. The basic problem: While one can anonymously ask a limited number of questions to public LLMs such as ChatGPT, Perplexity, etc., more in depth questions require an account and often a monthly subscription. And with an account comes the loss of privacy. But there’s an interesting solution:
Continue reading My AI Learning Journey – Part 8- OpenRouter – 350+ Models to Experiment With