After my initial delight of getting FTTH connectivity restored in Paris, I quickly realized that something is not quite in order. While getting well over 800 Mbps to some servers in the downlink, I got a meager 20 – 100 Mbps to others, even though they can deliver data much more quickly when I probe throughput from other places. At first, I thought that ‘Free’ must have a severely limited interconnect to those servers. But UDP iperf measurements to some of these servers showed that this was not the case. So I started to investigate and found the culprit: Very strange packet loss.
One important finding I made early on was that the speed degradation depends on the round trip time to the server. For measuring throughput, I used ‘wget’ to download files and ‘iperf3’ in downlink TCP mode. Uplink speed tests will follow in a separate post. A server in France close to my FTTH link would deliver data at around 100 Mpbs in the downlink direction. A server in Nürnberg, Germany, could still deliver 40 Mbps. And a server located in Finland delivered only 20 Mbps. This was over a 1 Gbps FTTH line, just to set this into perspective again. So what’s going on!?
To have a closer look, I used Wireshark to analyze the file downloads. To have a reference, I first ran some throughput tests on my 100 Mbps VDSL line in Germany. The first image below shows how the throughput over looks like over that VDSL line:
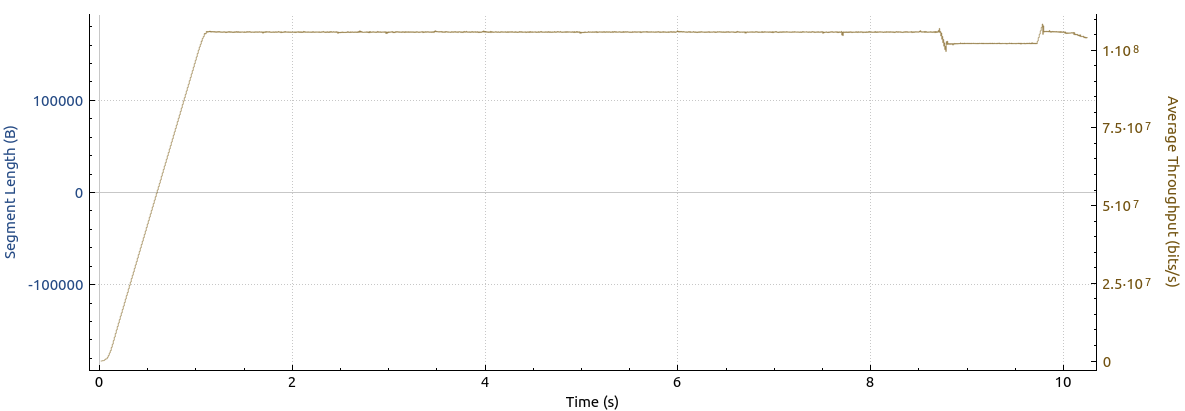
The graph shows a quick ramp-up to the full line speed (100 Mbps) and then an absolutely steady throughput at the maximum line rate. That’s how it is supposed to look like. Now let’s have a look at how the throughput graph of the same file transfer from the same server looks like over the FTTH line in Paris:
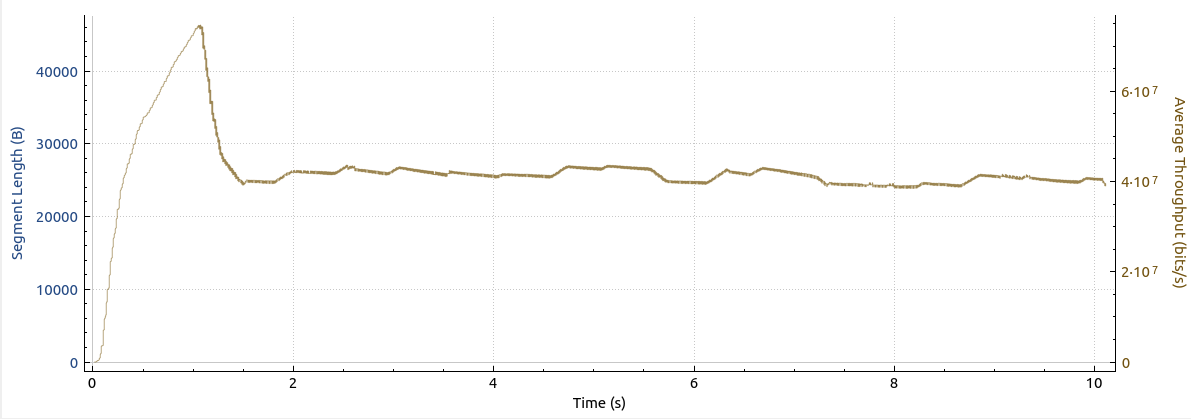
There’s two thing apparent here: There is a quick ramp up at the beginning but the throughput quickly reduces and settles at around 40 Mbps. Also, the line is not straight at all, which it should be. Instead it wiggles around. It’s also important to realize that once TCP ‘slow start’ has finished, the throughput should at least be 20 times the value shown in the graph above (800 Mbps or more instead of 40 Mbps)!
So let’s have a look at TCP sequence numbers and packet loss. The next image shows how the TCP sequence numbers, which represent the number of bytes transmitted, look like on the VDSL line in Germany:
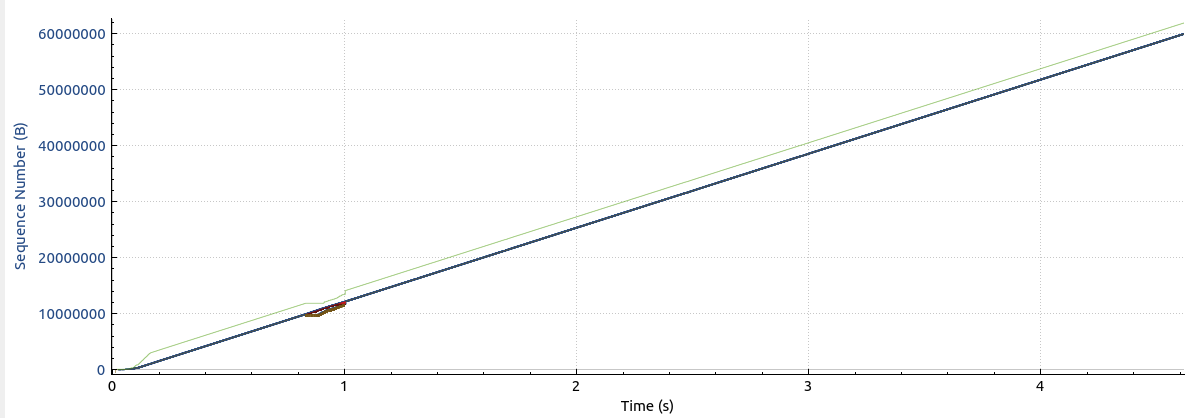
The scale of the X-axis hides the TCP ‘slow start’ mechanism a bit, but the graph shows that TCP finds the maximum line rate very quickly and hence, the graph shows a straight line. At around 800 ms, there is some packet loss as TCP discovers the maximum line rate and then backs off just a bit. This is normal behavior.
And here’s the same graph for the FTTH link in Paris:
The difference is immediately recognizable: Instead of a straight line right from the start which would indicate steady and maximum bandwidth use, the graph shows a curve that flattens at around 250 ms. This means that data transmission slows down considerably at this point, which corresponds to the throughput reduction in the second image above. If you look closely, you will see a number of red dots in this graph. These represent packet loss. There is quite a lot of it during the first quarter of a second and then in regular intervals of around 250 ms during the rest of the transfer.
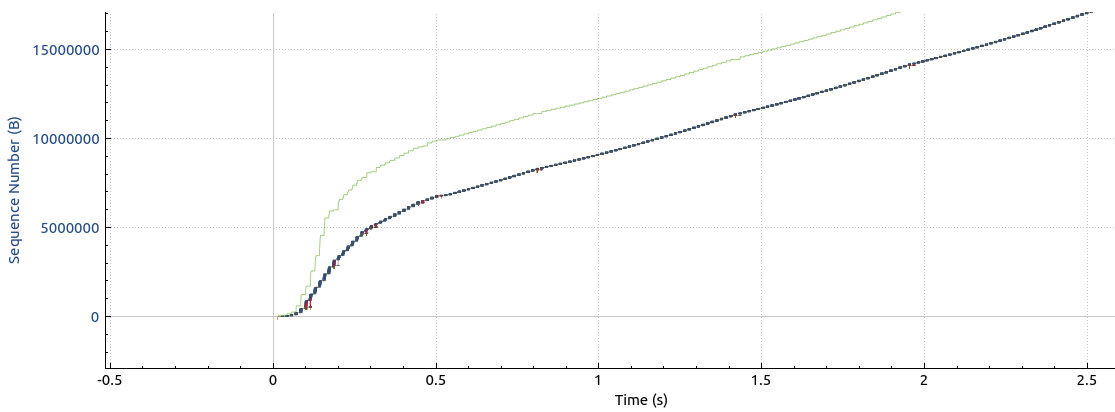
Let’s have a closer look at the TCP ‘slow start’ phase. The next image shows the first 500 ms of the data transfer over the FTTH line:
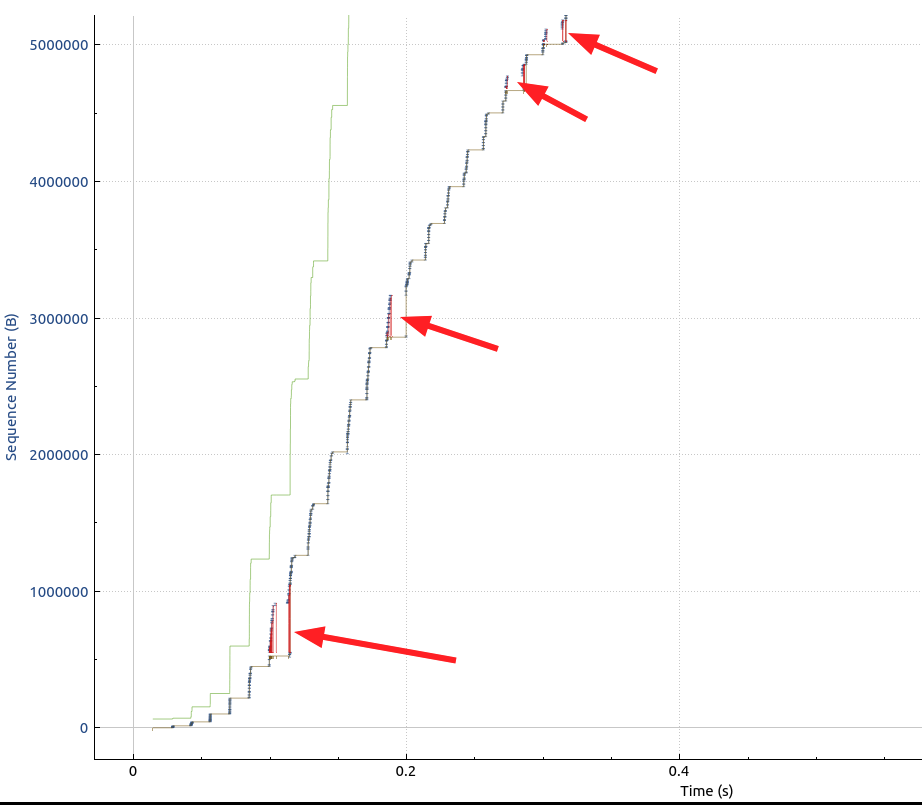
This is the TCP ‘slow start’ mechanism in action and it can be seen that TCP ramps up the data rate very quickly. It is essential that no packet loss occurs during that time, as most TCP congestion control algorithms (more details on this topic later) interpret packet loss during the ‘slow start’ phase as having reached the maximum line rate and back-off immediately. In this case, there are several packet loss events during the first 500 ms shown in the graph and this is what totally destroys the throughput and makes the TCP congestion control algorithm eventually back down to the 40 Mbps.
Also, throughput is not stable at 40 Mbps. Instead, the curve keeps wiggling. This is because of the periodic packet loss occurring roughly every 250 ms. When using different servers as source for the data, I see exactly the same behavior, but different round trip times and a different periodic interval for the packet loss.
So the big question is: Where does this packet loss come from? It’s definitely not a congested interconnect somewhere on the way from the servers. I checked UDP throughput from a number of servers to my client in Paris with iperf3 and got no packet loss up to around 300 Mbps. When going further, however, I started to get packet loss as well. Also, the behavior is exactly the same at all hours of the day and night. So I don’t think this is congestion related.
There could be many sources of that packet loss. Perhaps its my client, perhaps the FTTH/Wifi/Ethernet Switch box doesn’t like the Ethernet port of my client or vice versa. Or perhaps the SFP in the router is broken? Or perhaps it’s something in Free’s network? I don’t have the answer to this question yet, but obviously, I need to find out as things can’t stay this way.