It’s interesting how quickly the wind can turn sometimes. While my problems with 5 GHz Wi-Fi, i.e. radar detection and 160 MHz channels seems to have been fixed by cool software upgrades of the AVM devices I use, my first steps into the 6 GHz band with 802.11ax (Wi-Fi 6E) haven’t been as successful as I was hoping.
Continue reading The 6 GHz Wi-Fi MessAuthor: Martin
Wi-Fi Backhaul on a 160 MHz Channel – The Gbps in Sight!
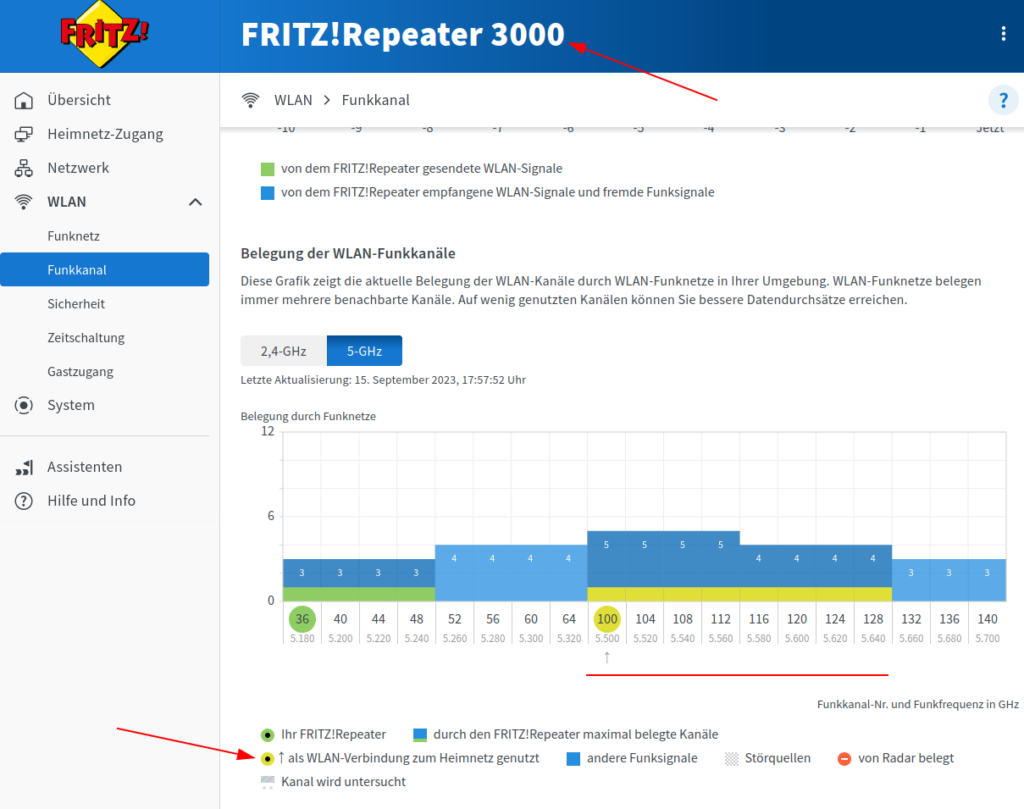
In the past, I’ve come very close to the 1 Gbps of a standard Ethernet connection over my Wi-Fi backhaul between a Fritzbox 7590 and a FritzRepeater 3000. However, it was not quite 1 Gbps, and every now and then the speed dropped to 500-600 Mbps. This was mainly for two reasons: While both devices supported 160 GHz channels between them on paper, AVM seemed to have had a problem with it on their Repeater 3000 and hence, they limited the channel bandwidth to 80 MHz in some software versions. Luckily, 4 MIMO streams are supported over 80 MHz, so I could still almost reach the 1 Gbps, despite the limited bandwidth. The second reason why I was a bit unhappy was that some software versions often fell back to the lower part of the 5 GHz band with a much more limited transmission power. So that was the status quo for quite a while.
Continue reading Wi-Fi Backhaul on a 160 MHz Channel – The Gbps in Sight!Switching To eSIM in Slight Distress
I’ve been following the development of the eSIM on this blog for 6 years now and in recent years, I’ve been downloading and testing eSIMs to see how the process actually works. However, all of that was for learning and educational purposes only. But now, finally, I’ve used an eSIM ‘for real’ to get me out of a slightly disconcerting situation.
Continue reading Switching To eSIM in Slight DistressMulti-Path Backhaul with Speedify – Part 2
Let’s continue where I left off in the previous post on the Speedify Internet backhaul bonding and redundancy software I installed on a Raspberry Pi, and have a closer look how throughput looks like in practice.
Continue reading Multi-Path Backhaul with Speedify – Part 2Multi-Path Backhaul with Speedify – Part 1 of 2
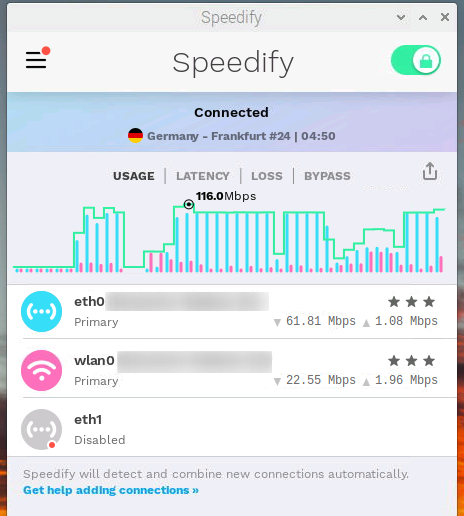
Every now and then I am at places at the fringe of the observable Internet where I only have slow, weak and unreliable connectivity. Typically, though, there are several of such networks to chose from, for example because network operators share towers. Wouldn’t it be great if one could combine those networks to get some more speed and reliability out of it? Until recently, I wasn’t aware of an easy way to do this. But then I noticed a world traveler on Twitch who regularly streams while driving, even at remote places. His solution: Combining Internet connectivity from a Starlink dish on his RV’s roof and two cellular connections with a software called Speedify on a Raspberry Pi. Hm, sounds like this is just what I need.
Continue reading Multi-Path Backhaul with Speedify – Part 1 of 2Power for Dishy: The Anker 521 Powerhouse
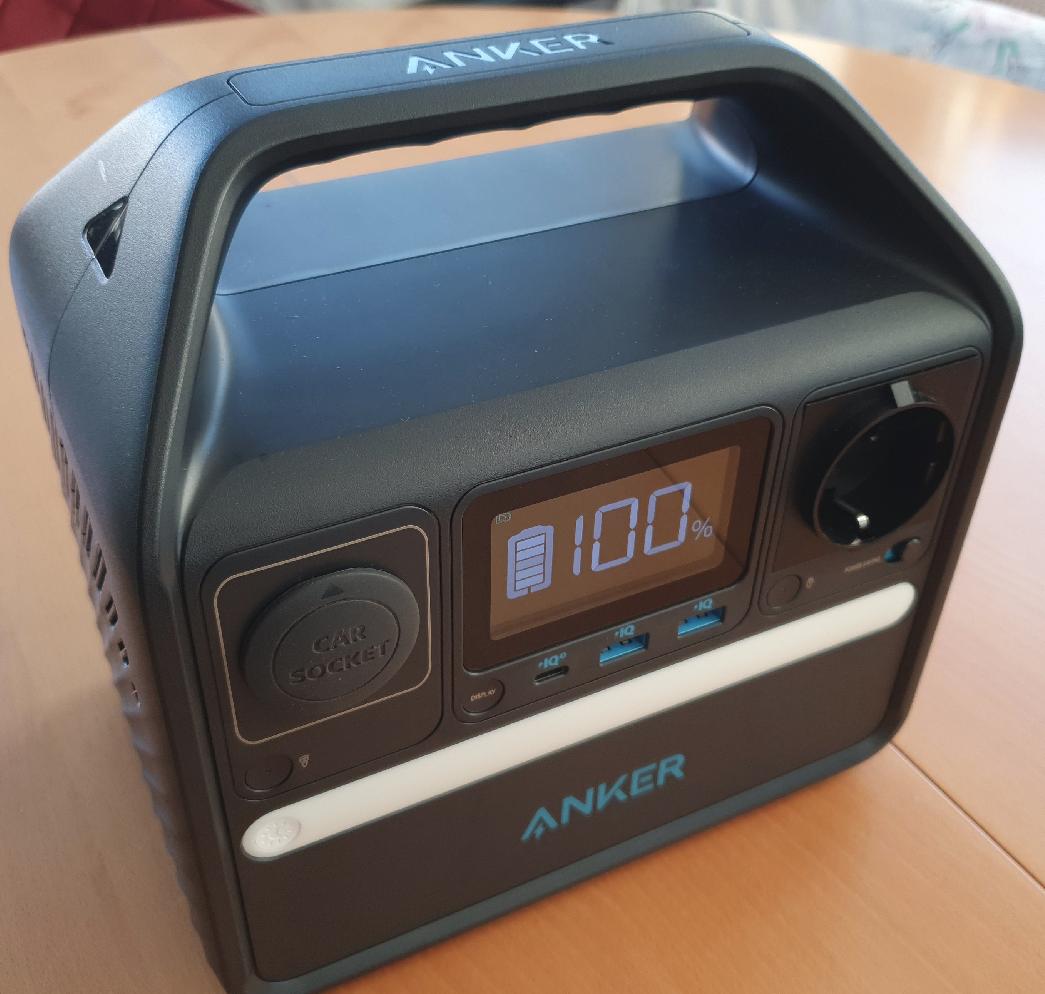
One thing I was pretty certain about when I bought my Starlink terminal was that I would put it in places where power would not be readily available. Maybe only a few meters away, but still, out of reach. As the Starlink router requires a 110/230V power source, a USB battery pack doesn’t work. And even if it did, most USB battery packs could not supply 55 watts on average and 70-80 watts during startup. So I was looking for another solution that could supply power for at least a few hours.
Continue reading Power for Dishy: The Anker 521 PowerhouseRemoving Indentation from 3GPP Messages – ChatGPT vs. Google Search
If you are in the business of looking at decodes of LTE or 5G signaling messages, you’ve probably been at the point when you wanted to copy and paste a part of that message into an email. The problem: More often than not, the parameters you are interested in are deeply nested in other parameters. 60 to 80 spaces in front of parameter lines are not out of the ordinary these days. Looks pretty ugly when copied and pasted and the result is often totally unreadable. So I was looking for a way to remove a specific number of spaces of all lines of a text file. Should be an easy Google search I thought, but the result was quite disappointing.
Continue reading Removing Indentation from 3GPP Messages – ChatGPT vs. Google SearchWi-Fi Bandwidth Vs. Range Vs. Throughput
In the previous post on using a Wi-Fi channel in the 2.4 GHz band connecting my Starlink terminal in a courtyard to an in-house receiver, I noticed that the 20 MHz channel was limiting my speed to around 60 Mbps. That’s far less than what Starlink supports and also far less than the roughly 100 Mbps that a 20 MHz 802.11n channel supports in the 2.4 GHz band on the IP layer (130 Mbps on the PHY). At first, I thought that there is little that can be done about it, as the channel is clearly power limited. Focusing the signal energy in a certain direction might help, but there are no antenna connectors on the Starlink Wi-Fi router to which I could connect directional antennas. But then I noticed an interesting effect when increasing the channel bandwidth.
Continue reading Wi-Fi Bandwidth Vs. Range Vs. ThroughputStarlink – Part 14 – Dishy Among Trees and Hills
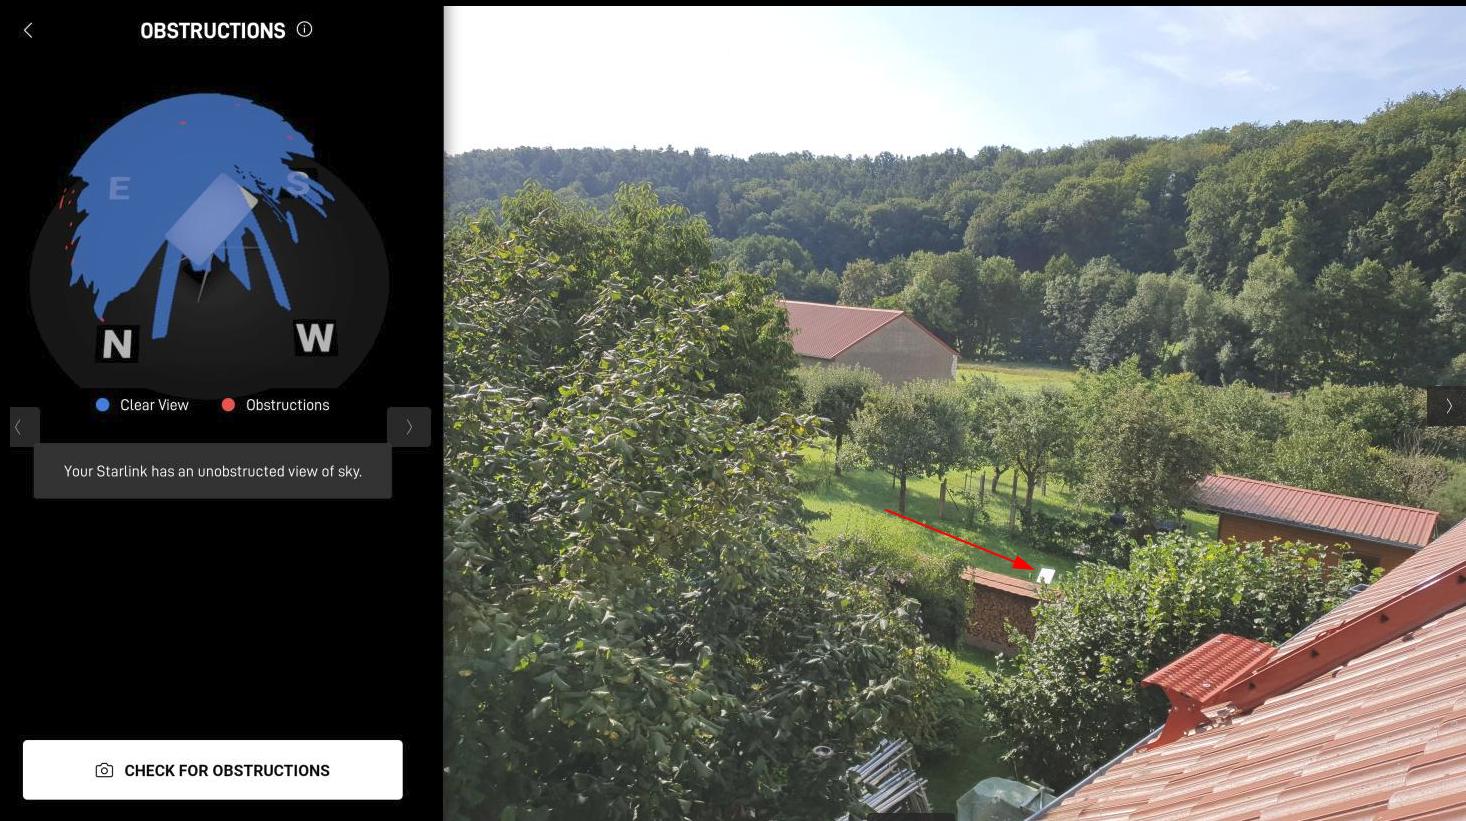
And further I went into ‘terra incognita’ with Starlink, this time to a place which was quite challenging in terms of terrain. But again, looking at the bright side of it, it was the first time I had to experiment for a while to find a good spot to place ‘Dishy’.
Continue reading Starlink – Part 14 – Dishy Among Trees and HillsStarlink – Part 13 – Local Wi-Fi on 2.4 GHz
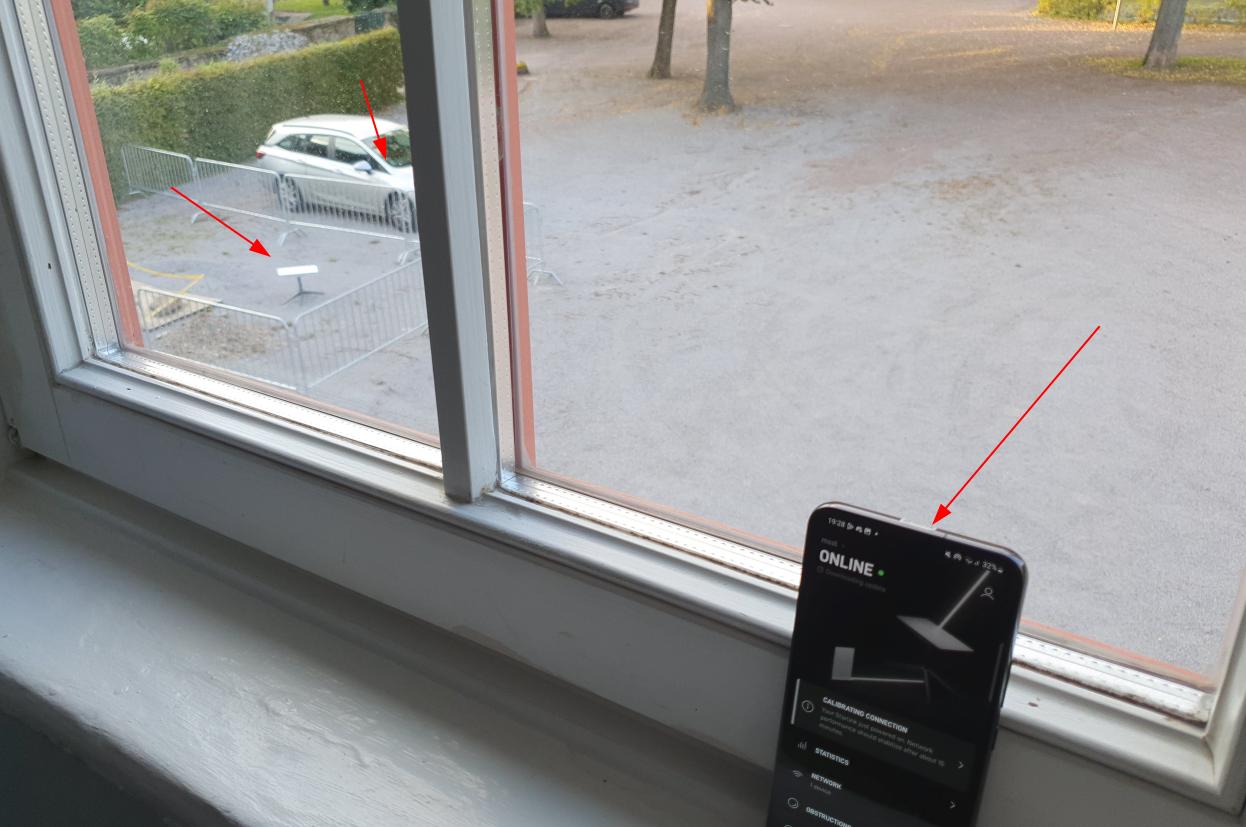
In the previous post, I had a look at the 5 GHz Wi-Fi of the Starlink router at close range for maximum throughput. In this post, I’ll have a look at the completely opposite scenario: How Starlink’s Wi-Fi performs when used to bridge a larger distance. This wasn’t actually a theoretical test, but the scenario I bought my Starlink terminal in the first place: Fast Internet connectivity in ‘underserved’ places. As you can see in the picture above, I put the satellite antenna itself in a courtyard, while the router and the 230V power supply (more about that in a follow up post) was in the car next to it.
Continue reading Starlink – Part 13 – Local Wi-Fi on 2.4 GHz