O.k. I admit it, the sheer performance of video calls on current notebook processors made me go for a new instead of a used notebook, as incidentally, a couple of other unforeseen developments required the move anyway. So instead of buying a used Lenovo X270 with a 7th generation Intel processor from 2017 with 2 cores and 4 CPU threads, I went for a new Thinkpad X13 Gen 1 from 2020 with an AMD Ryzen 7 4750U CPU with 8 cores and 16 CPU threads. So here’s the story of how that went.
Continue reading My New Thinkpad X13 with 16 CPU Threads – First ImpressionsBooting From /dev/sdb
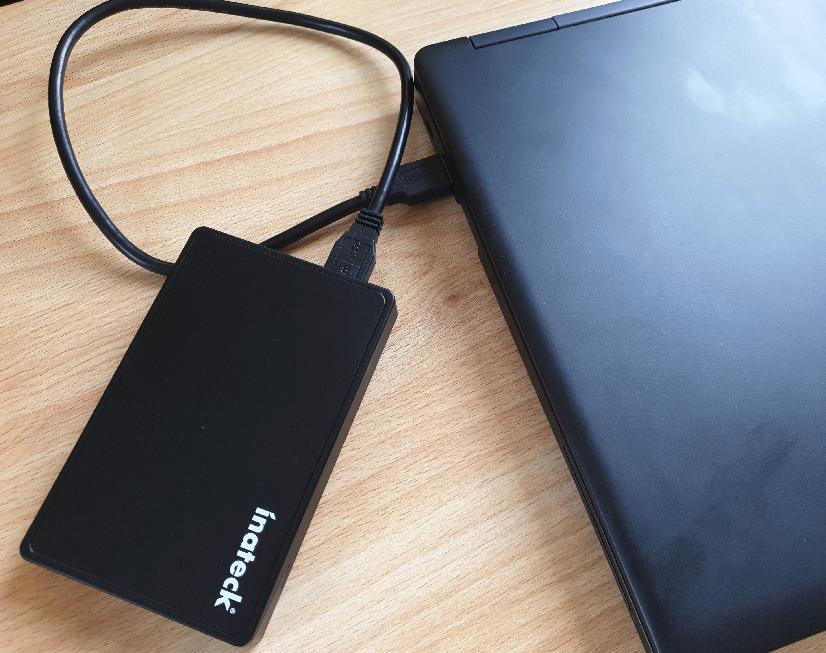
When installing a new OS, I am quite used to booting a computer from a USB drive. However, from way back in the days I faintly remember that connecting a drive with an installed Linux system with a SATA to USB adapter to a notebook / server would not work. Particularly so when the notebook / server already contains a disk drive that uses the default SATA port (/dev/sda). But I recently discovered that things have become way better these days!
Continue reading Booting From /dev/sdbRouting it Your Way Part 3: Socat for OpenVPN Forwarding
O.k., I’m going deeper and deeper down the layer 7 routing rabbit hole. As I like to have a plan B when it comes to my infrastructure at home, I have backup Internet connectivity over a separate Internet connection and a separate router. When main connectivity fails, a script detects that my services are no longer reachable. It then changes the DynDNS entries of all domains I use at home to point to the IP address of the backup connectivity. So far, so good.
But here is the catch: Backup connectivity is routed through a VM on the Internet that terminates ssh reverse port mapping tunnels from my VMs at home. These tunnels do not use the main Internet link so they don’t break when connectivity is lost. Instead, the VMs at home have an entry in the routing table for the IP address of the cloud VM that points to the backup connectivity router. This works great but has one major shortcoming: ssh can only tunnel TCP ports. Unfortunately, OpenVPN and similar products use UDP as transport protocol, and hence, ssh tunneling doesn’t work. But there’s another way!
Continue reading Routing it Your Way Part 3: Socat for OpenVPN ForwardingM.2 Slots – SATA and NVME SSDs
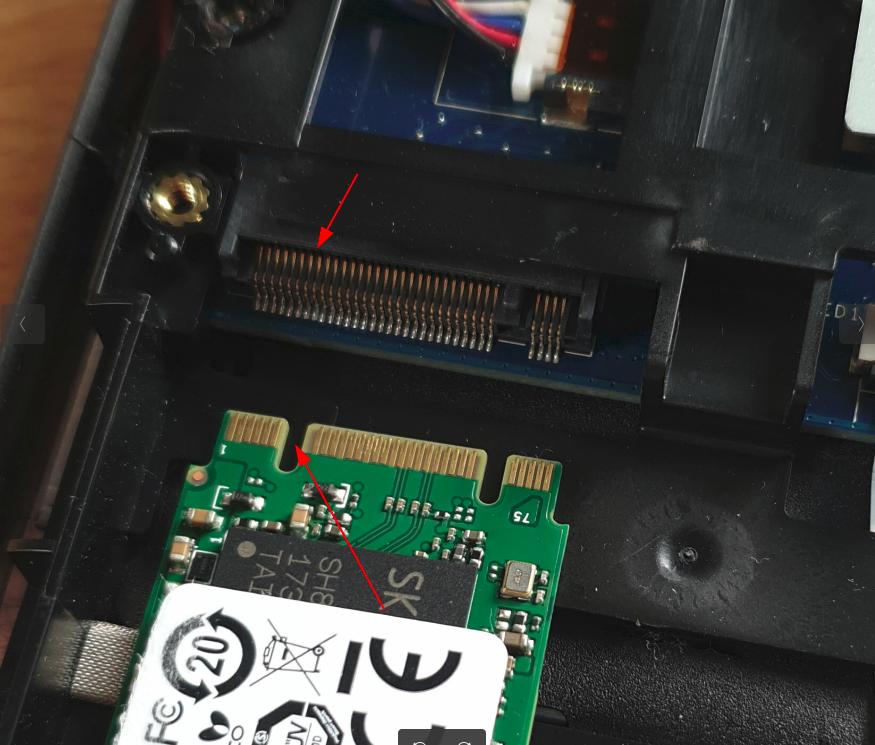
A quick hardware episode today because every now and then I was puzzled about how to identify if an M.2 SSD is a SATA drive or if it supports the faster and today’s more common NVME interface. The same goes for the M.2 connector on the notebook side. Turns out it is quite simple.
Continue reading M.2 Slots – SATA and NVME SSDsVideo Calling Performance On New Notebooks
By and large, I am pretty happy with my approach of using a refurbished notebook as my main device for my daily work. Currently, I use a Lenovo X250 from 2015, i.e. it’s around 6 years old. It runs fast enough and I don’t perceive a significant difference when I sit in front of a newer notebook that also runs Linux. Until recently.
Continue reading Video Calling Performance On New NotebooksRouting it Your Way Part 2: ssh + socat to Simplify Tunneling
In a previous post I’ve described of how ssh reverse tcp forwarding and socat forwarding can be used in combination to make the services of a server without a public IP address and no ssh access available to the outside world. The setup requires two intermediate gateway servers, one on the Internet and one in the local network. On the one hand, this is complicated but on the other hand offers a number of interesting simplifications if you have more than just one server in your local network that you want to expose to the world. Let me explain…
Continue reading Routing it Your Way Part 2: ssh + socat to Simplify TunnelingRouting It Your Way Part 1: ssh + socat
Every now and then I get questions that make me think in new directions and the results are often useful far beyond the original intent. Here’s an example: For many years I’ve been using ssh reverse tcp port forwarding to make servers available on the Internet that are behind a NAT, for example in a home network without a public IP address. Here’s my original post from back in 2014 and here’s a post about a talk I gave on the topic in 2019. But what if one can’t initiate an ssh tunnel from the server behind the NAT? Well, I have a solution for that as well now: Combining ssh and socat!
Continue reading Routing It Your Way Part 1: ssh + socatConfidential Computing – Some Thoughts
At the end of 2020, I first came across the term Confidential Computing for the first time over here. This article describes how to encrypt a virtual machine image and then upload and run it on a physical host of a cloud provider without the cloud provider being able to look into the VM and into the virtual disk image. If this was actually offered by a cloud hosting company in the future, it would go a long way to overcome my aversion of processing sensitive personal data in the cloud. Over the next months, however, it turned out that the term ‘Confidential Computing’ is used for quite a number of different things, so one has to be very careful what people mean when they are using this term. So let’s have a look at the different kinds of Confidential Computing.
Continue reading Confidential Computing – Some ThoughtsCoding and Deploying From the Edge of the Observable Internet
o.k., the title of this post is a bit of a mouthful but I found the analogy to the Observable Universe and what lies beyond interesting. This post is about an interesting learning experience I went through a number of times in recent weeks: Staying at places for several days with marginal Internet connectivity and trying to get my everyday projects done. The question: How much should I do locally, and how much do I push in the cloud and run from there?
Continue reading Coding and Deploying From the Edge of the Observable InternetRunning OBS Studio in the Cloud
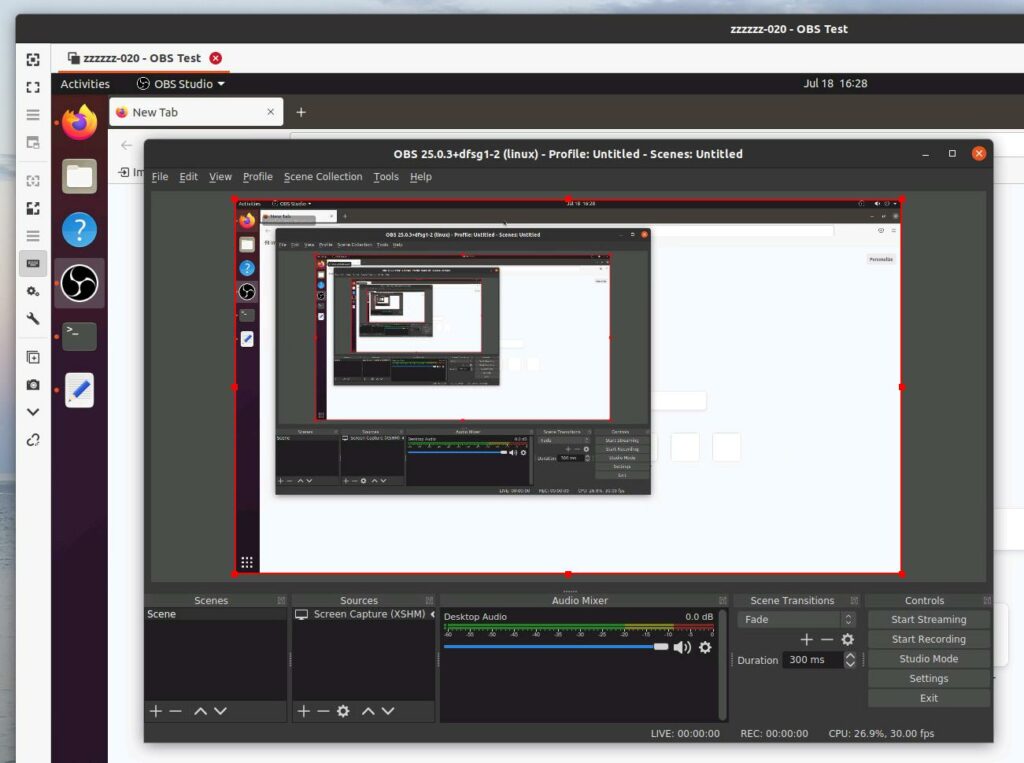
In 2020, the Vintage Computing Festival had to happen online. For this, we used quite a number of virtual machines in the cloud (i.e. in a datacenter) to host the BBB video conference servers. The live streams of the talks, however, ran on a physical notebook and we used OBS Studio to record the screen of that notebook and stream it to to the CCC distribution network. And it looks like we are going to have at least a part of this year’s event in the cloud again. So it was time to think a bit about how to improve last year’s setup. Pretty high on my list: Virtualize that notebook with OBS on it and push it out into a virtual machine in the cloud.
Continue reading Running OBS Studio in the Cloud