
After the more high level parts 1 and 2 on Starlink, it’s now time to have a closer look at how the Starlink downlink channel behaves. I’m totally amazed by the system and it performs very well in Germany. That being said, it probably comes as no surprise that on the IP layer, the graphs produced by the data transmission over satellites look very different from the same graphs produced by a data transfer over a fixed line VDSL link. For the comparison, I’ve used Starlink over the router’s built in Wi-Fi and compared it to my VDSL line at home, which is also connected to a 5 GHz Wi-Fi router.
TCP Congestion Avoidance Algorithms
Before going further, let’s quickly talk about another important parameter: For this post, both sender and receiver did NOT use the standard Linux Cubic TCP congestion avoidance algorithm. Instead, BBR was activated on both sides, as it reacts much faster to missing packets. This is the standard setup for all my computers and servers, and a comparison between TCP Cubic vs. TCP BBR over Starlink will follow in the next post.
So let’s go on. The screenshot at the beginning of the post shows the throughput of a 30 seconds iPerf3 downlink transmission over Starlink in bit/s, with the upper end of the scale at 1.75*10⁸ bit/s, i.e. 175 Mbps. The graph shows that overall performance is pretty good, but one can also see a very variable channel that dips down to 75 Mbps at times. Now let’s compare this to my VDSL line downlink throughput shown in the next screenshot.
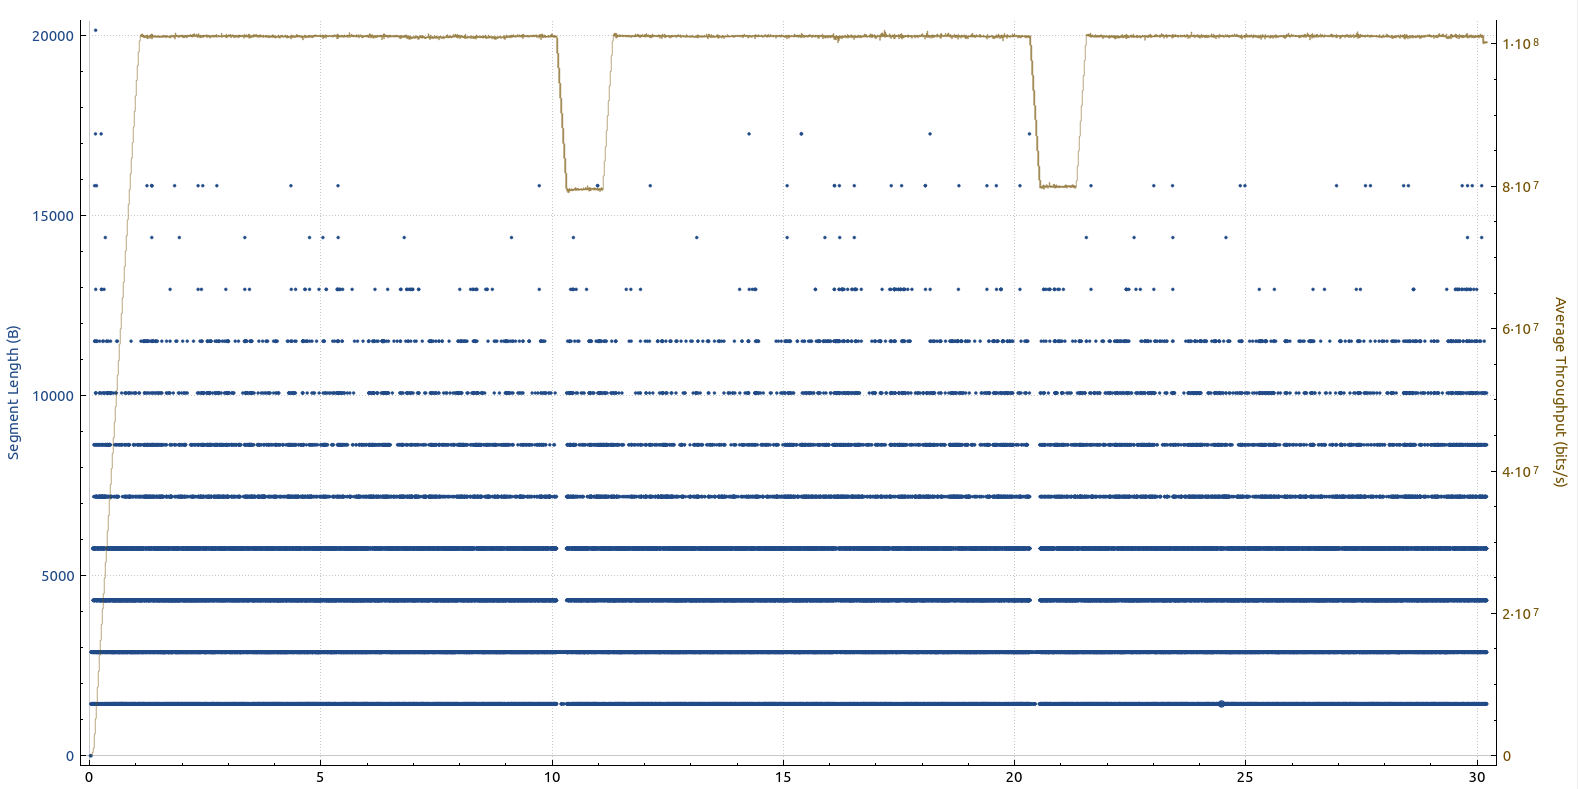
Here, the throughput is almost constant, with only 2 dips at the 10 and 20 seconds mark. The speed of my VDSL line is 100 Mbps, so overall, my VDSL line is slower than the data transmission over Starlink.
Packet Loss
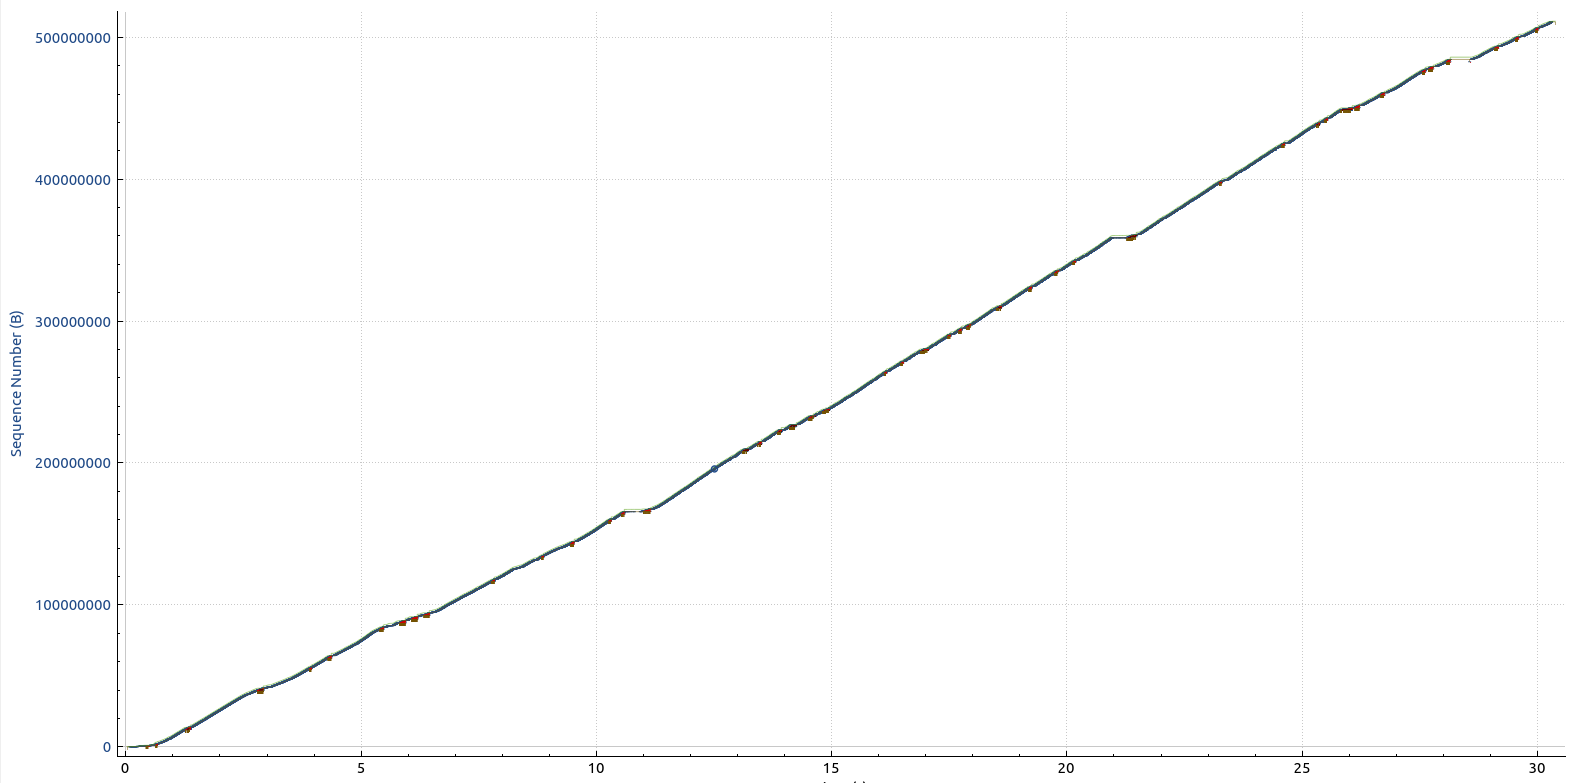
So why is the Starlink downlink throughput so variable? The next screenshot shows the TCP sequence numbers of the downlink transfer over Starlink and gives the answer: Missing or late TCP segments. Throughout the transfer, there are frequent packet losses which leads to slowdowns and retransmissions. Click on the image and open it in a separate tab for a closer inspection. The red dots or rather sequences show where packet loss occurs.
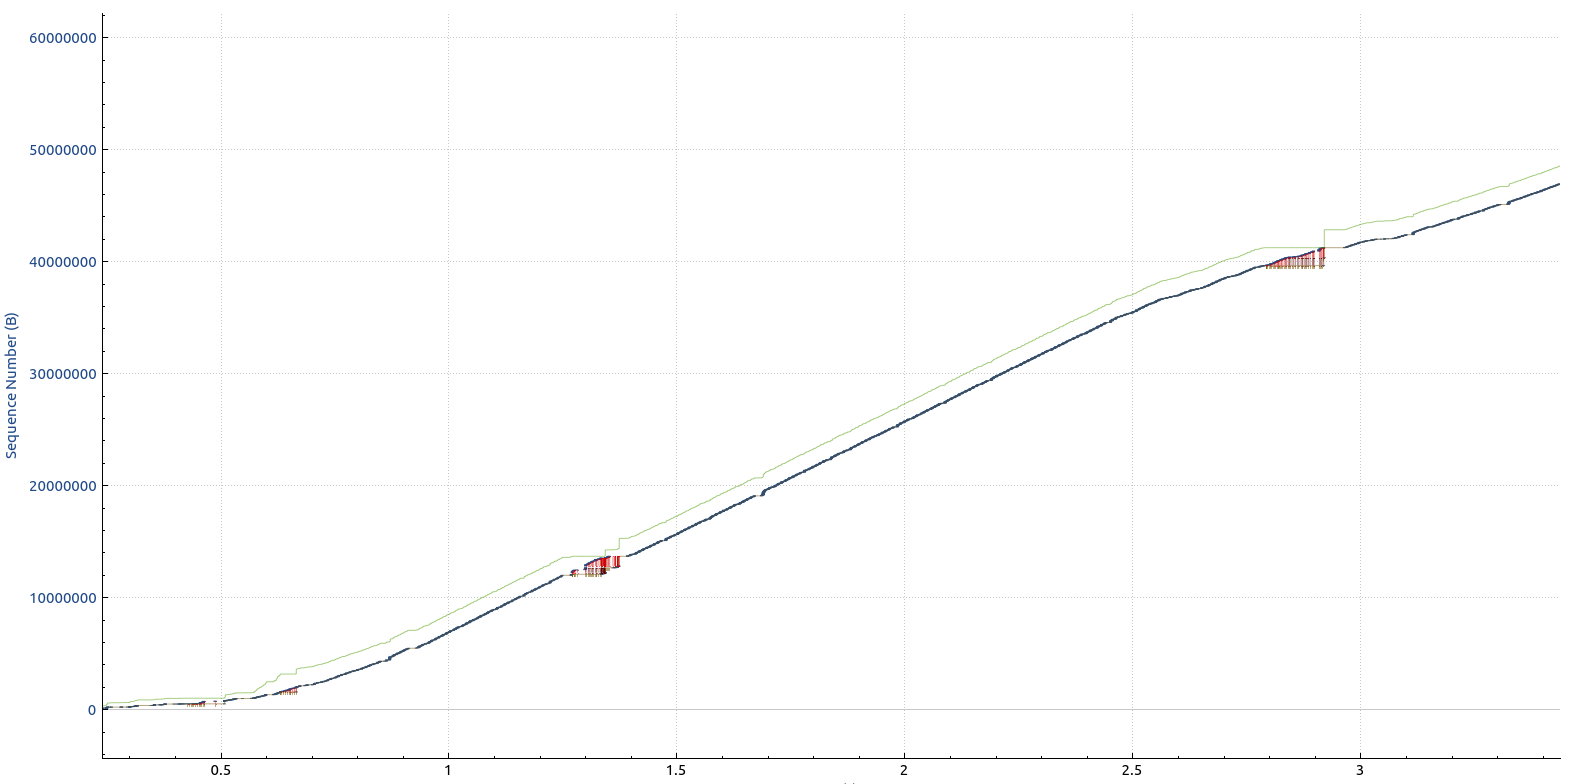
For an even closer look, here’s a screenshot that shows the first 3 seconds of the transmission:
It might not look very pretty, but it still works very well. And just for comparison, here’s the 30 seconds TCP sequence number graph for an iPerf3 downlink transmission over my VDSL line:
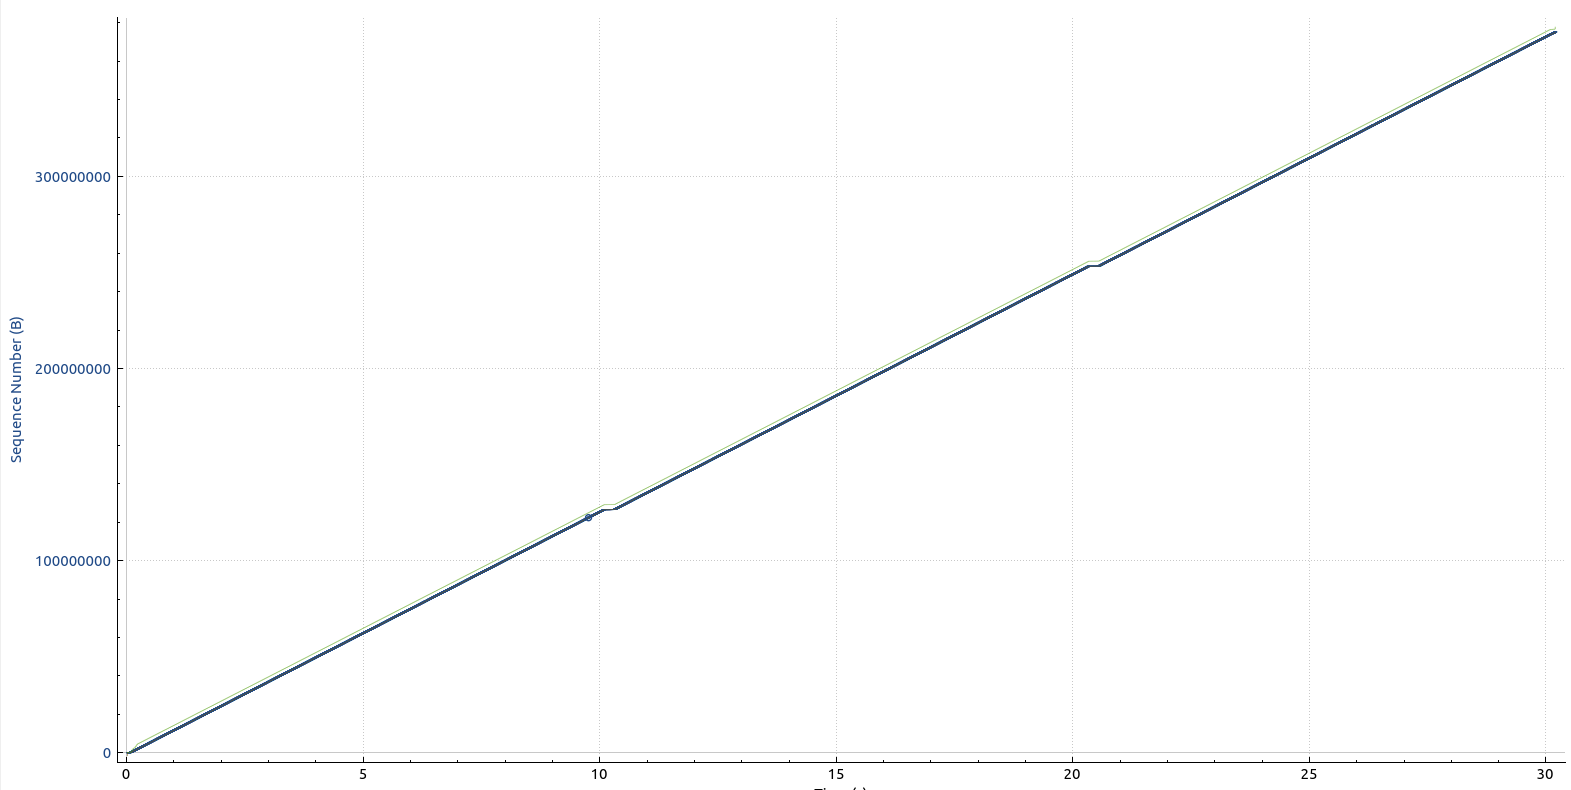
No lost packets anywhere, so that’s quite another thing.
Summary
Starlink is definitely magic, but the magic has its limits. Not surprisingly, the channel is quite variable, and if I saw such graphs over a fixed line or even LTE/5G connection, I would be worried. But this is a satellite system, so my expectations are different. And one has to remember that despite of the packet loss, the system works very well, at least with the non-standard BBR TCP congestion avoidance algorithm.
So much for today. In part 4, I’ll have a look at how the system performs in the downlink direction with the default TCP Cubic algorithm. Let’s keep your fingers crossed the results are equally convincing.