Starlink – Part 14 – Dishy Among Trees and Hills

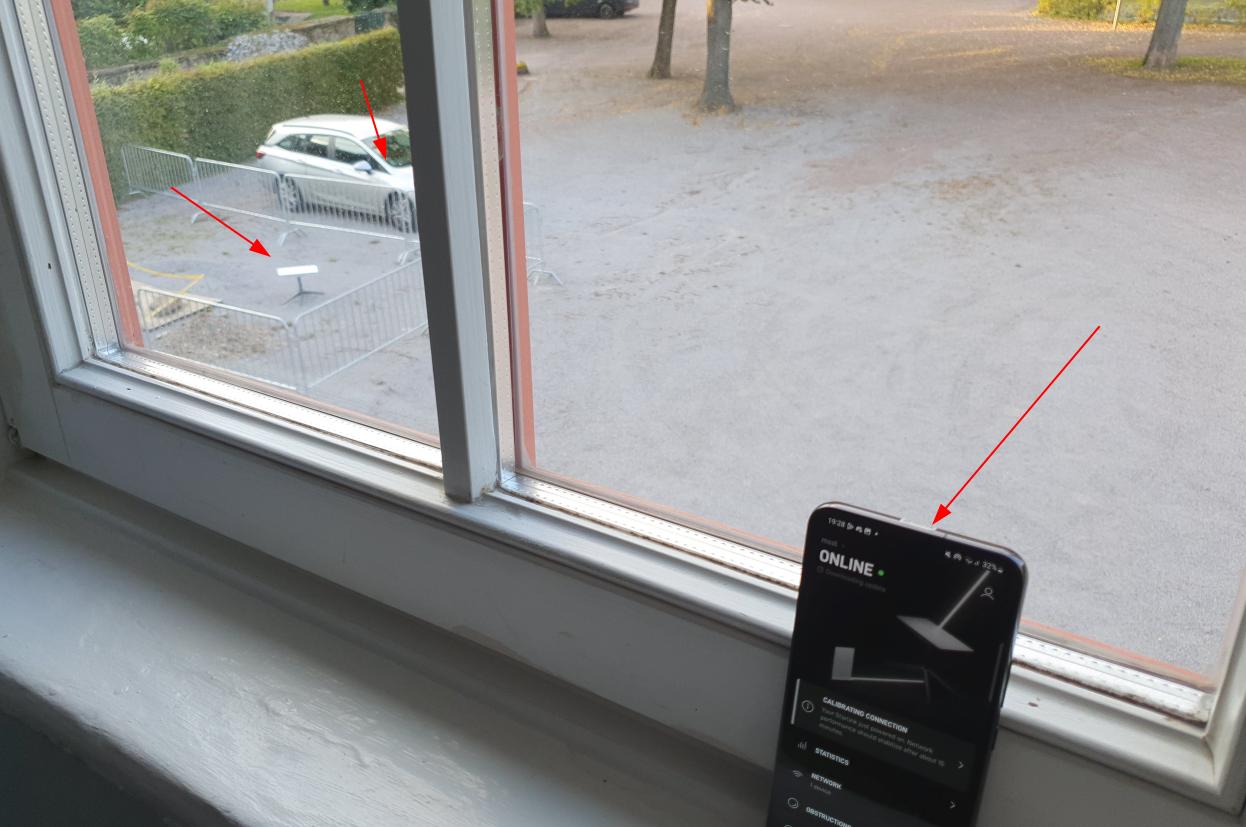
Challenging terrain around the Starlink dish as seen from the north-west

And further I went into ‘terra incognita’ with Starlink, this time to a place which was quite challenging in terms of terrain. But again, looking at the bright side of it, it was the first time I had to experiment for a while to find a good spot to place ‘Dishy’.

Continue reading Starlink – Part 14 – Dishy Among Trees and Hills

Starlink – Part 13 – Local Wi-Fi on 2.4 GHz

Outdoor Starlink setup with a 2.4 GHz Wi-Fi link to the house

In the previous post, I had a look at the 5 GHz Wi-Fi of the Starlink router at close range for maximum throughput. In this post, I’ll have a look at the completely opposite scenario: How Starlink’s Wi-Fi performs when used to bridge a larger distance. This wasn’t actually a theoretical test, but the scenario I bought my Starlink terminal in the first place: Fast Internet connectivity in ‘underserved’ places. As you can see in the picture above, I put the satellite antenna itself in a courtyard, while the router and the 230V power supply (more about that in a follow up post) was in the car next to it.

Continue reading Starlink – Part 13 – Local Wi-Fi on 2.4 GHz

Starlink – Part 12 – Local Wi-Fi on 5 GHz

Out of the box, a Starlink terminal comes with the satellite dish, affectionately called ‘Dishy’, and a Wi-Fi Router. As an Ethernet port is not part of the package and has to be ordered separately, Wi-Fi is the only default connectivity option. So how does that Wi-Fi Access Point perform?

Continue reading Starlink – Part 12 – Local Wi-Fi on 5 GHz

Starlink – Part 11 – Obstruction Diagram

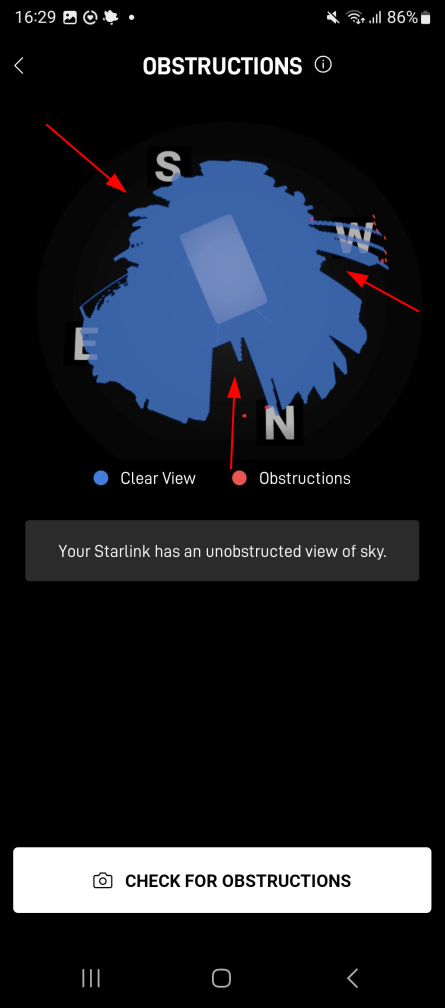
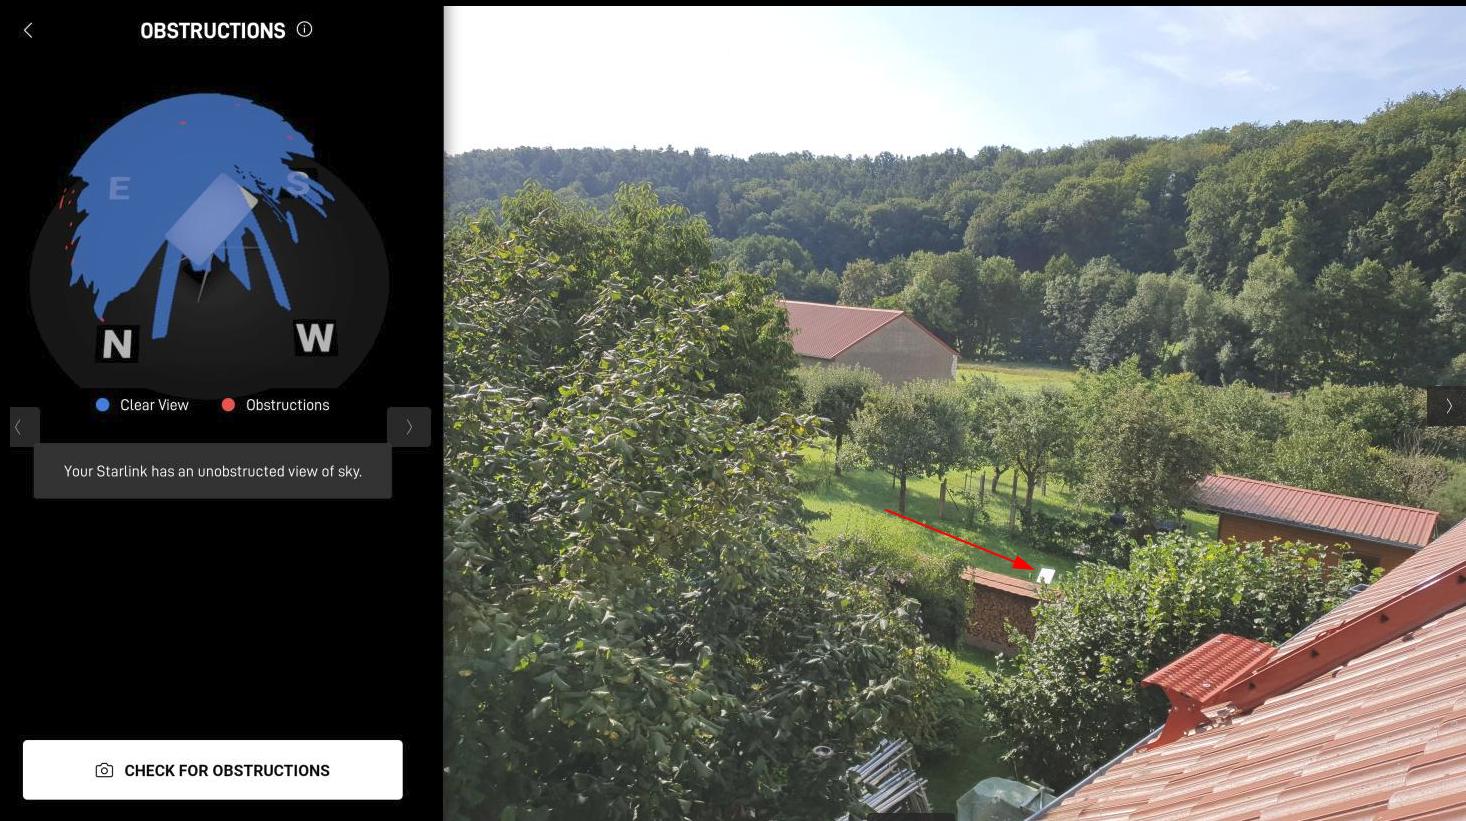
How much of the sky can be obstructed for Starlink to still work without connectivity breaks (in Germany)? This has been one of the most important questions I had about Starlink before I could try it out on my own.

Here’s an image that shows an obstruction diagram, which the Starlink app on a smartphone produces after ‘Dishy’ has been up and running for about 6 hours. The blue sphere shows the parts of the sky that are visible, while the black area shows where obstacles are in the way. The red arrows were put into the image by me. For this image, the Starlink dish was at my rooftop, and the sky was blocked as follows:

1) About half the sky to the south was completely blocked by a near vertical part of roof, which is about 2.5m high (red arrow on the top left). Dishy was about 0.5m away and hence, this part of the roof pretty much obstructed half of the sky.

2) Towards the north, there was a solid obstacle about 1 meter away and about 1.5 meter high which is also shown nicely on the image (red arrow at the bottom.

3) And finally, there was another 1.5m high obstacle towards the west, also around 1m away from the antenna, which also blocked the sky.

Continue reading Starlink – Part 11 – Obstruction Diagram
Starlink – Part 10 – Windows over Starlink – Uplink Performance

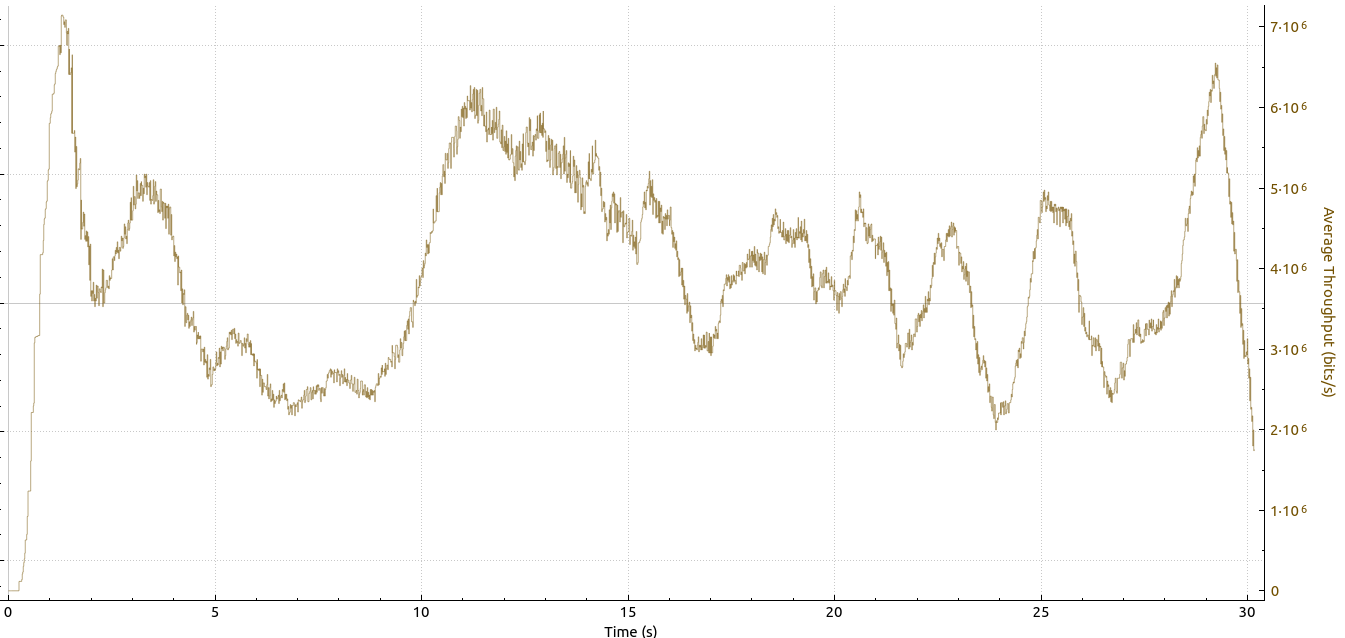
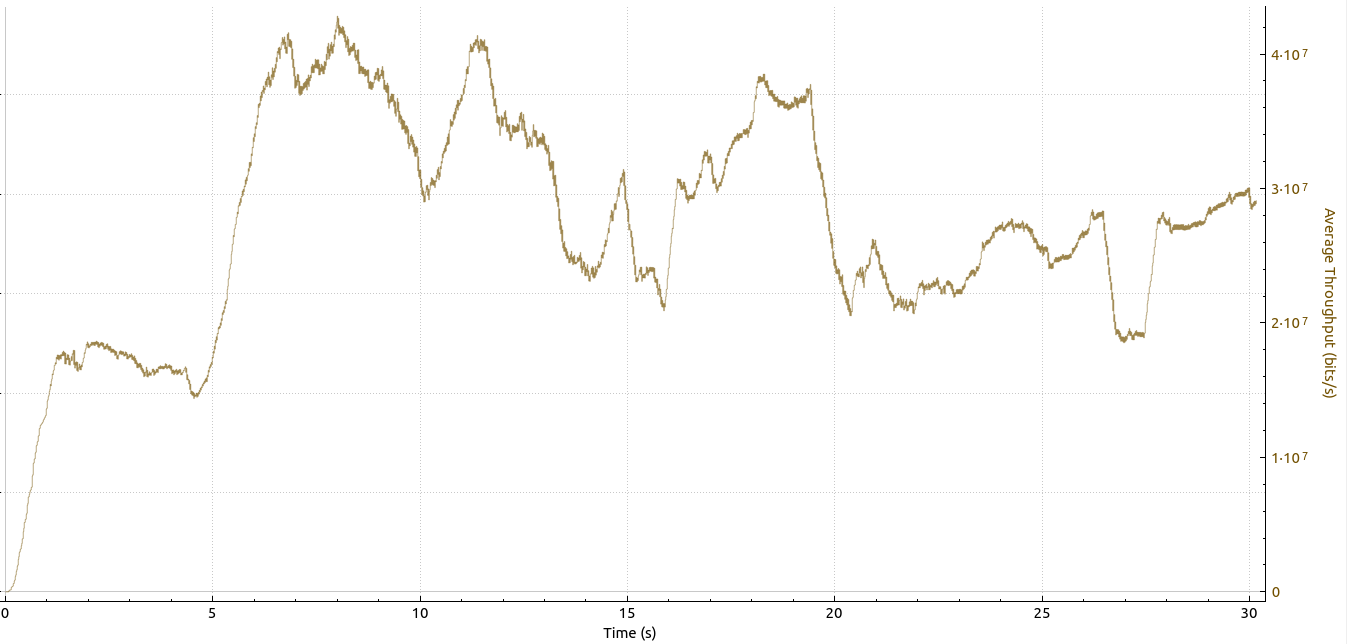
Windows 11 uplink throughput over Starlink with iPerf3

Part 8 of this series took a closer look at the downlink performance of two Windows 11 based machines over Starlink. This episode now takes a closer look at the uplink.

Before I go on, let’s set expectations: As was shown in part 5 and 6, there is a significant difference in uplink performance on Linux machines depending on which TCP congestion avoidance algorithm is used. With the default TCP Cubic algorithm, throughput was around 5 Mbps, whereas TCP BBR pushed uplink throughput to 30 Mbps.

So here’s how uplink throughput looks like on Windows with the default TCP parameters:

Continue reading Starlink – Part 10 – Windows over Starlink – Uplink Performance

Starlink – Part 9 – Speedtest.net and LibreSpeed

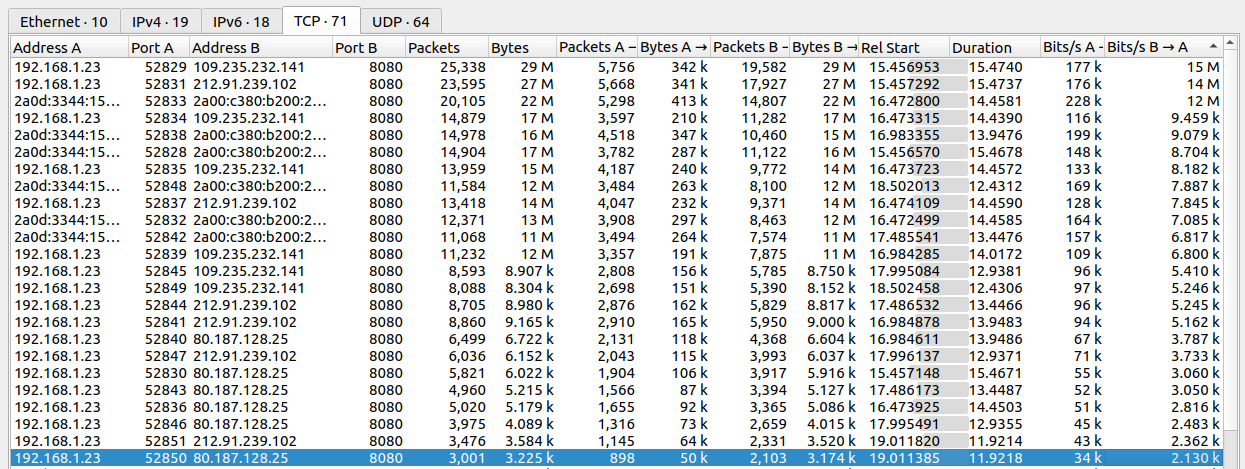
Wireshark ‘Conversations’ analysis of a speedtest.net speed test

In part 8 of my Starlink series, I’ve been looking at downlink throughput with a Windows notebook. The maximum speed I could achieve with iperf3 was around 30 Mbps, while tools like speedtest.net and LibreSpeed could easily reach 150 to 200 Mbps. So what’s the difference and which speed test reflects real world use?

Continue reading Starlink – Part 9 – Speedtest.net and LibreSpeed

Starlink – Part 8 – Windows over Starlink – Downlink Performance

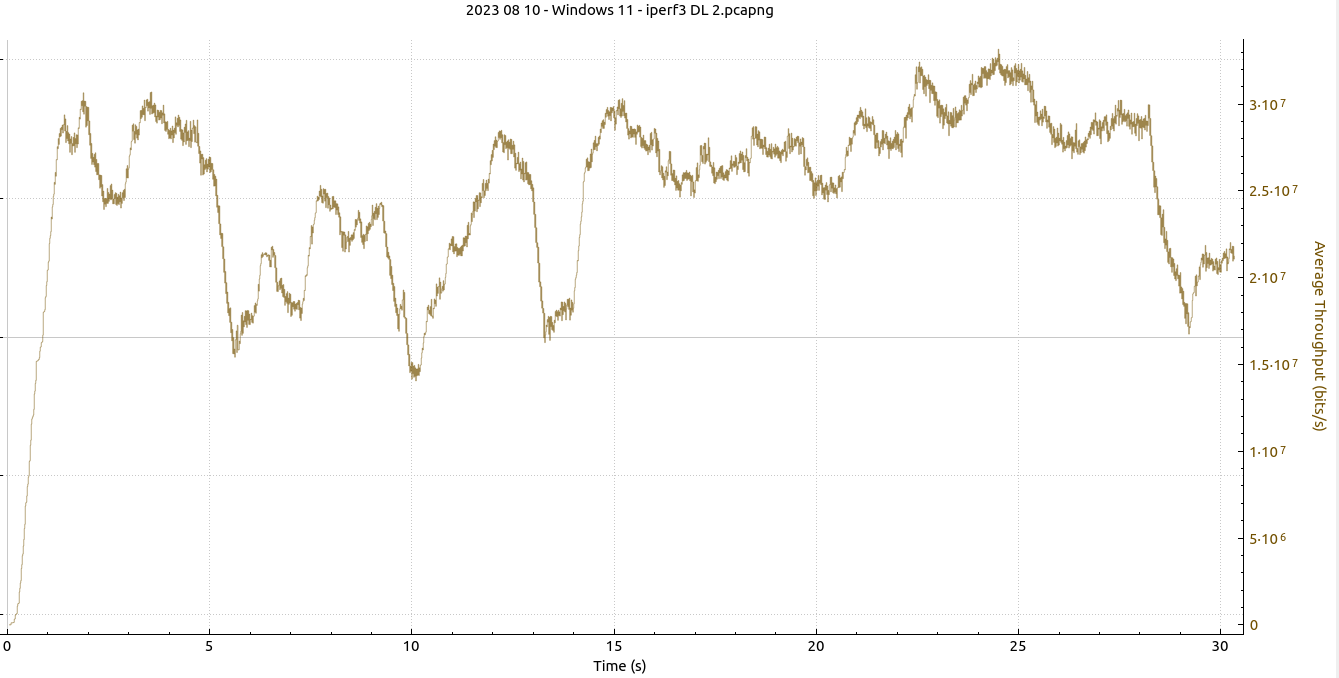
In my previous posts on Starlink, I’ve used Linux as the operating system on my notebook and on the network side server for my iPerf3 throughput measurements. Due to packet loss on the link, there is a significant difference between using different TCP congestion avoidance algorithms. When the standard Cubic algorithm is configured on both sides, the data transfer over a single TCP connection is 5 times slower than with BBR. So what happens when I use a Windows client over Starlink?

Continue reading Starlink – Part 8 – Windows over Starlink – Downlink Performance

Starlink – Part 6 – Uplink Performance with BBR

Starlink iperf3 uplink throughput with the TCP BBR congestion avoidance algorithm.

So here we go: After the interesting but somewhat slow Starlink uplink throughput results discussed in part 5, let’s have a look if the TCP BBR congestion avoidance algorithm can improve the situation. BBR is not configured out of the box, but I use it on all of my servers and workstations. BBR could be particularly helpful for uplink transmissions, as it is a sender side measure. Thus, it doesn’t matter which TCP algorithm is used on the receiver side, which, for this test, was a box in a data center .

Continue reading Starlink – Part 6 – Uplink Performance with BBR

Starlink – Part 5 – Uplink Performance – Standard Cubic

Starlink’s Dishy in the wild

In part 3 and 4 of this Starlink discovery series, I’ve been taking a look and the downlink throughput performance. While the standard Cubic TCP congestion avoidance algorithm used by Linux produced only meager results, switching to BBR produced a five-fold throughput increase. So how about throughput in the uplink direction?

Continue reading Starlink – Part 5 – Uplink Performance – Standard Cubic